Article Text

Abstract
Objectives: Declines in brain glucose metabolism have been described early in Alzheimer’s disease (AD), and there is evidence that a genetic predisposition to AD contributes to accelerate this process. The epsilon4 (e4) allele of the apolipoprotein E (ApoE) gene has been implicated as a major risk factor in this process. The aim of this FDG-PET study was to assess the ApoE e4 dose related effect on regional cerebral glucose metabolism (METglc) in clinical AD patients, with statistical voxel based methods.
Methods: Eighty six consecutive mild to moderate AD patients included in the Network for Efficiency and Standardisation of Dementia Diagnosis database underwent FDG-PET scans at rest. PCR was used to determine the ApoE genotype. Patients were grouped as e4 non-carriers (n = 46), e3/e4 (n = 27) and e4/e4 (n = 13) carriers. A voxel-based mapping program was used to compare each AD subgroup with a database of 35 sex and age matched controls (p<0.001, corrected for cluster extent) and also to compare between the subgroups (p<0.001, uncorrected).
Results: No difference was found as to age at examination, age at onset, sex, disease duration, educational level, or severity of dementia between AD subgroups. Compared with controls, all AD subgroups had equivalent METglc reductions in the precuneus, posterior cingulate, parietotemporal, and frontal regions. Direct comparisons between AD subgroups indicated that patients with at least one e4 allele had METglc reductions within additional associative and limbic areas compared with e4 non-carriers.
Conclusions: The present FDG-PET study showed different metabolic phenotypes related to the ApoE genotype in clinical AD patients, as revealed with voxel based statistical methods. The results suggest a generalised disorder in e4 carriers impairing metabolism globally, in addition to the more localised changes typical of AD patients.
- Alzheimer’s disease
- ApoE
- FDG
- PET
- ageing
- ACC, anterior cingulate cortex
- AD, Alzheimer’s disease
- ApoE, apolipoprotein E
- BA, Brodmann area
- FOV, field of view
- METglc, glucose metabolism
- MRI, magnetic resonance imaging
- NEST-DD, Network for Efficiency and Standardisation of Dementia Diagnosis
- PET, positron emission tomography
- ROI, regions of interest
- SPM, statistical parametric mapping
- STL, superior temporal lobe
Statistics from Altmetric.com
- ACC, anterior cingulate cortex
- AD, Alzheimer’s disease
- ApoE, apolipoprotein E
- BA, Brodmann area
- FOV, field of view
- METglc, glucose metabolism
- MRI, magnetic resonance imaging
- NEST-DD, Network for Efficiency and Standardisation of Dementia Diagnosis
- PET, positron emission tomography
- ROI, regions of interest
- SPM, statistical parametric mapping
- STL, superior temporal lobe
In the last 10 years, considerable progress has been made towards the identification of the biological mechanisms underlying Alzheimer’s disease (AD).1 AD is characterised by severe memory impairment, with a neuropathological background of synaptic loss, amyloid plaques, and neurofibrillary pathology,2 as well as cholinergic deficits.3,4 Moreover, declines in brain glucose metabolism have been described early in AD, even prior to the overt manifestation of amnesic symptoms and cerebral atrophy.5–7 Most neuroimaging studies have reported that AD is related to abnormal metabolic and perfusion reductions, mostly expressed in the precuneus, posterior cingulate, parietotemporal, and frontal associative areas.8
Genetic and epidemiological studies have implicated the epsilon 4 (e4) allele of apolipoprotein E (ApoE) as a major risk factor for development of both the familial and sporadic forms of AD.9,10 Indeed, the inherited dose of the e4 allele has been associated with an increased risk of developing AD and a lower age at disease onset.11,12
However, the impact of the ApoE genotype on the regional pattern of decreased cerebral perfusion and metabolism typically detected in AD patients is unclear. Although FDG-PET studies have demonstrated that metabolic reductions are detectable even in non-demented elderly persons carrying at least a single ApoE e4 allele,5,6,13,14 the few studies on clinical AD patients have provided contrasting results.
Most studies have been performed with the regions of interest (ROI) extraction technique, which allows examination only of a subset of predetermined brain areas, and they focused preferentially on the associative cortices. One follow up SPECT study showed reduced cerebral perfusion in the parietal and occipital cortices of e4 homozygous patients compared with e4 heterozygotes and non-carriers.15,16 Conversely, the three studies that examined the gene dosing effect provided no evidence for a disrupting role of the e4 allele on brain functional parameters.17–19
In contrast, only one FDG-PET study has been performed so far with a voxel based analysis.20 Compared with the ROI technique, voxel based methods for anatomical image normalisation and statistical parametric mapping (SPM) allow assessment of all possible significant changes in the whole brain and at the single voxel level.21,22 Using SPM, Hirono et al showed that carriers of the e4/e4 genotype have metabolic decreases in the medial temporal lobe and increases in the parietotemporal cortices compared with e3/e3 carriers, and that this is related to the age at disease onset.20 However, this effect was observed for early onset patients only, and the gene dosage effect was not examined.
The present FDG-PET study was aimed to assess whether AD patients present with different metabolic phenotypes depending on their ApoE genotype. A voxel based analysis using the Statistical Parametric Mapping (SPM’99) program was performed to assess the impact of the inherited dose of the e4 allele on regional cerebral glucose metabolism (METglc) in both early and late onset AD patients.
MATERIALS AND METHODS
AD patients
Eighty-six consecutive mild AD patients were included in the study. Written informed consent was obtained from all patients, in accordance with institutional guidelines. All patients were diagnosed according to the criteria of the National Institute for Neurological Disorders and Stroke and of the Alzheimer’s disease and Related Disorders Association.23 Subjects were included with or without a family history of AD (defined as at least one first degree relative with a clinical diagnosis of AD). The study procedures included examinations by neurologists and psychiatrists, routine laboratory tests, neuropsychological examinations, EEG, magnetic resonance imaging (MRI), and positron emission tomography (PET) scans, and blood samples for genetic analysis. Patients were excluded in cases of: (a) complications of other medical illnesses possibly causing cognitive impairment, such as thyroid disease, vitamin deficiencies, and malignant disease; (b) mental disease, substance abuse, or significant neurological antecedents (brain trauma, tumours, epilepsy, vascular dementia, other dementing illnesses, and inflammatory disease); or (c) evidence of focal brain lesions on MRI.
Subjects were recruited in the context of the Network for Efficiency and Standardisation of Dementia Diagnosis (NEST-DD) research project (www.nest-dd.org) funded by the EEC, and were studied for cerebral glucose metabolism by PET between November 2000 and November 2002 at our institute. Patients were enrolled in this study based on their genetic characterisation. DNA was obtained from blood samples to determine the ApoE genotypes, by using standard PCR, as described by Sorbi et al.24 Three AD subgroups were decided upon: (a) 46 ApoE4 non-carriers (8 with the e2/e3 genotype and 38 with the e3/e3 genotype); (b) 27 ApoE4 heterozygotes (e3/e4 genotype); and (c) 13 ApoE4 homozygotes (e4/e4 genotype).
The characteristics of the patients under study are reported in table 1. We used analysis of variance to test differences in demographic and clinical data between AD subgroups. The Scheffé method was applied in post hoc analyses. The level of significance was set at p<0.05.
Demographic and clinical characteristics of AD patients carrying the different ApoE genotypes
Controls
Thirty-five healthy and unmedicated sex and age matched subjects (19M, 16F; mean age 69.3 (5.6) years, range 64–81 years; education: 10.3 (3.2) years; MMSE 26 or higher), included in the NEST-DD database, were used as controls. With their informed consent and approval by local ethics committees, they had been studied with PET under the same conditions and using the same scanning protocol at three collaborating laboratories, the Cologne, Liege, and Dresden centres, with PET scanners that differed with respect to field of view (FOV) and spatial resolution. ECAT EXACT, ECAT 951, and ECAT EXACT HR+ scanners were used, with an axial FOV of 162, 108, and 155 mm, an in plane FWHM of 6, 8.5, and 3.6 mm and a slice thickness of 3.375, 3.37, and 2.46 mm, respectively. Studies were performed on subjects in a resting state with eyes closed and ears unplugged after intravenous injection of 110 to 370 MBq 18F-2-fluoro-deoxy-d-glucose (FDG). Required minimum time interval between injection and scan start was 30 min. On average, scans were started 42 (19) minutes after injection. Required minimum scan duration was 10 minutes, and mean scan duration was 19 (3) minutes. Images were reconstructed using filtered back projection including correction for attenuation (measured by transmission scan) and scatter using standard software as supplied by scanner manufacturers. Further details can be found in Herholz et al.8 All subjects underwent clinical and neuropsychological examinations to exclude organic brain disease and cognitive impairment.
PET
The detailed FDG-PET scanning procedure employed was as described by Bartenstein et al.25 Briefly, patients were injected with a dose of 370 MBq [18F] fluoro-2-deoxy-d-glucose (18F-FDG), in a resting state, with eyes closed and ears unplugged, in a dimly lighted room with minimal background noise. Thirty minutes after FDG administration, a scan lasting 20 minutes was acquired, using a GE Advance PET device. A polycarbonate head holder was used to reduce head movement during the scan. Emission scans were acquired in two dimensional mode with an axial FOV of 15 cm and a planar FOV of 50×50 cm. Images were reconstructed by filtered back projection. Attenuation correction was performed according to Chang’s method.26 Thirty-five PET slices were acquired using a 256×256 matrix with a pixel dimension of 2.14×2.14 mm and the slice thickness was 4.25 mm.
Image transformation
A MS-DOS version of NEUROSTAT (kindly provided by the Department of Internal Medicine, University of Michigan, Ann Arbor, MI, USA) running on a Windows Me system was used to realign PET images relative to the anterior–posterior commissural line (AC-PC) and to normalise them to the FDG-PET template provided by NEUROSTAT to match the standard stereotactic Talairach and Tournoux space.27 Normalisation to the Talairach space was done using a nine parameter linear affine transformation and a non-linear warping deformation.22
Thereafter PET images were converted into Analyze format using ImageJ software (http://rsb.info.nih.gov/ij/). Voxel by voxel statistical analysis was performed with SPM’99 (Wellcome Functional Imaging Laboratory, London, UK) implemented in MATLAB, (version 5.3). Images were smoothed with an isotropic gaussian filter (12 mm full width at half maximum) to account for individual variability in structure–function relation and to enhance signal to noise ratio.21 Individual global counts were normalised by proportional scaling. The grey matter threshold was set to 0.8 of the mean and global calculation was obtained with respect to the mean voxel value.
Statistical analysis
Comparisons between controls and AD subgroups
Each AD genotypic subgroup (ApoE4 non-carriers v e3/e4 genotype v e4/e4 genotype) was compared with the database of healthy controls. Differences between groups were estimated according to the general linear model using linear t contrasts. The significance threshold was set at p<0.001, corrected for cluster extent. The resulting statistical parametric maps (SPMs) were converted to Z scores. Brain areas identified through the SPMs were then identified and labelled according to the Talairach and Tournoux space27 by using the Talairach Daemon Database 2002 (http://ric.uthscsa.edu/projects/talairachdaemon.html).28
Comparisons between AD subgroups
The pooled data were assessed with the F statistic to identify the brain regions that significantly differed between the three AD genotypic subgroups. Results were considered significant at p<0.001, uncorrected for multiple comparisons. Brain areas showing significant differences between groups were then identified through the SPMs and labelled as described in the previous paragraph.
As the F statistic is non-directional, post hoc tests are required to assess which group mean differs from the others. The post hoc Scheffé test was used to compare METglc data between AD subgroups, using STATISTICA [version 4.5; StatSoft Inc, 1993]. Direct group mean comparisons were performed on the normalised METglc volumes extracted from the brain areas associated with significant differences between AD subgroups. METglc data were extracted from spherical regions of 10 mm diameter, centred at each local maximum of statistical significance. The left and right sides of each brain area were separately taken into account. The critical value for statistical significance was set at p<0.05.
RESULTS
Patient demographics
There were no significant differences between AD subgroups in gender distribution, age at examination, age at disease onset, disease duration, years of educational level, or severity of disease (table 1).
FDG-PET data
Comparisons between controls and AD subgroups
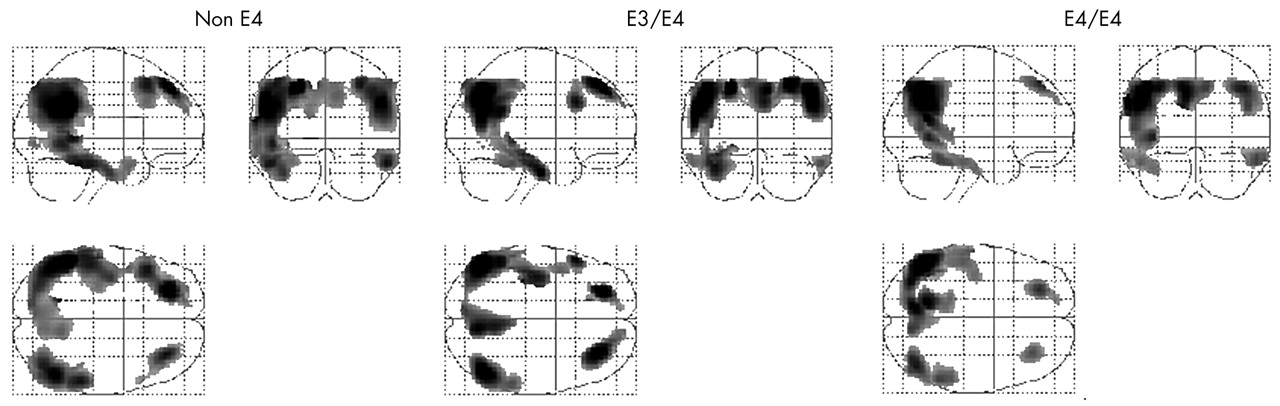
All AD subgroups presented similar topographical patterns of METglc reductions compared with controls. Significant METglc reductions were found bilaterally in the frontal lobe, comprising the superior and middle frontal gyrus (Brodmann area (BA) 8, 9); the parietal lobe, including the inferior parietal lobule and the supramarginal gyrus (BA 39, 40); the inferior temporal gyrus (BA 20); the posterior cingulate gyrus (BA 31); and the precuneus (BA 7). The corresponding SPM results are listed in table 2 and displayed in fig 1.
Peak voxel localisation and significance of the brain regions characterised by reduced metabolism in the e4 non-carriers (non-e4), e3/e4, and e4/e4 AD patients compared with controls

Statistical parametric maps (SPMs) showing areas of significantly lower METglc in e4 non-carriers (non-e4, left panel), e3/e4 (middle), and e4/e4 carriers AD patients (right panel), compared with control subjects (p<0.001, corrected for cluster extent). Results (black) are displayed as SPM projections in the three orthogonal right lateral (left), posterior (middle), and superior (below left) views.
Comparisons between AD subgroups
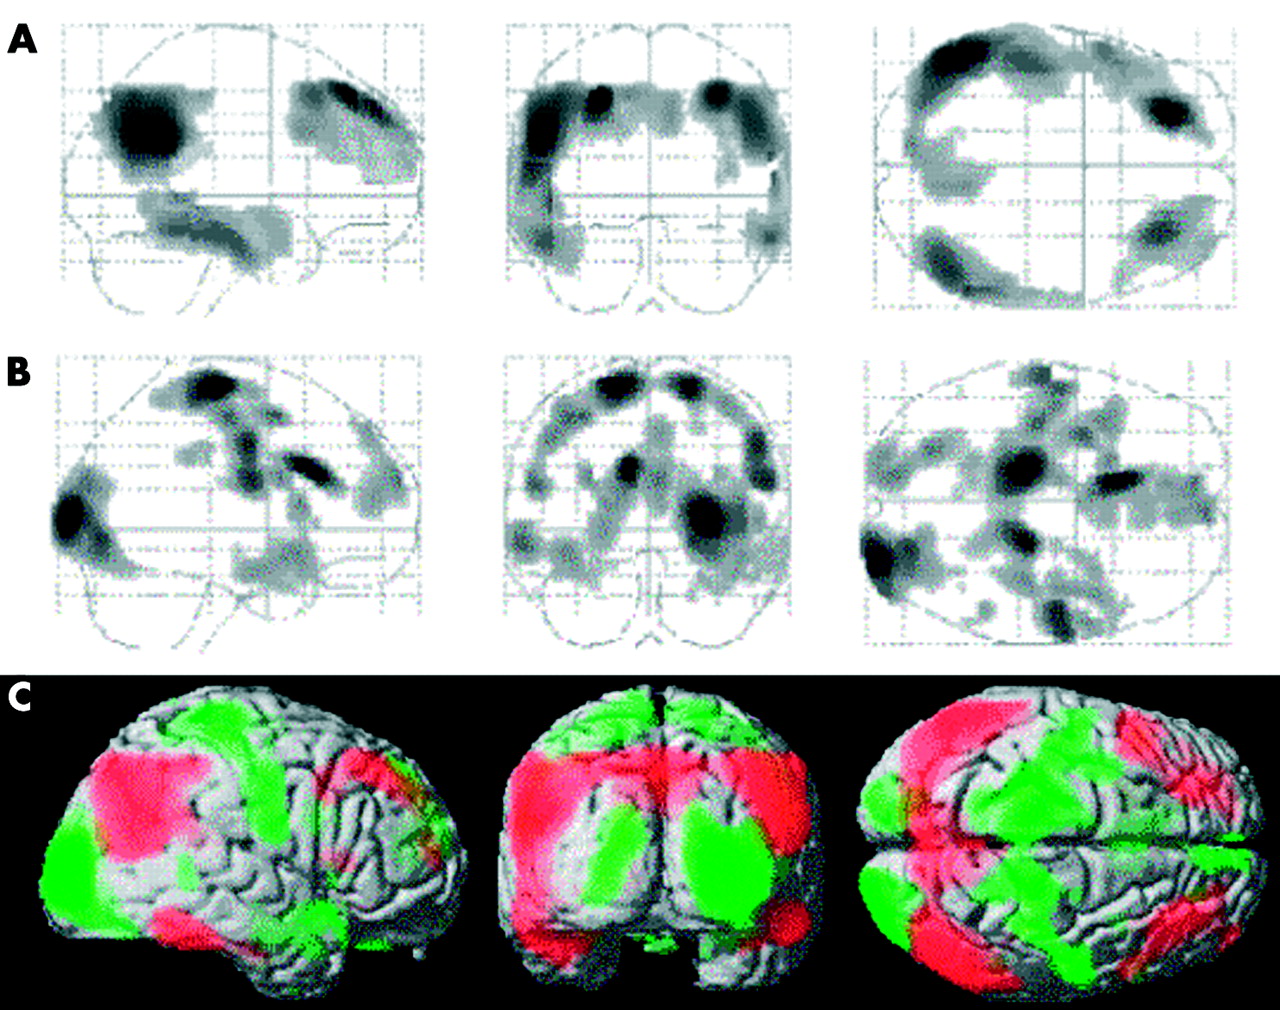
Significant differences were found between AD genotypic subgroups (fig 2A). At the cortical level, group differences were found in the pre-central frontal gyrus (BA 6), bilaterally, and in the right middle occipital lobe (BA 18). Within the limbic system, the left anterior cingulate cortex (ACC) (BA 24) was involved. Anatomical localisation, Talairach coordinates, and statistical significance for each area are reported in table 3. Direct comparisons between the three AD subgroups showed that both the e3/e4 and e4/e4 carriers had lower METglc within the ACC and the occipital lobe compared with the e4 non-carriers, whereas the e4/e4 carriers had lower METglc in the pre-central frontal cortex, bilaterally, compared with both e4 non-carriers and e3/e4 carriers (fig 2C).
Peak voxel localisation and significance of the brain regions characterised by significant metabolic differences between AD genotypic subgroups (e4 non-carriers, e3/e4, and e4/e4). Results reaching significance at p<0.001 and at p<0.005 are presented in separate sections.

Metabolic differences in AD patients. Statistical parametric maps (SPMs) showing areas of regional cerebral metabolic rate of glucose (METglc) difference between ApoE4 non-carriers (non-e4), e3/e4 and e4/e4 carriers, reported at p<0.001 (A) and p<0.005 (B), uncorrected. Results (black) are displayed as SPM projections in the three orthogonal right lateral (left), posterior (middle) and superior (right) views. (C) METglc data extracted from the brain areas listed in table 3 and corresponding to the SPMs displayed in (B). METglc was normalised to a mean voxel value of 50 μmol/100 g/min.38 PCe, pre-central cortex; FC, frontal cortex; OC, occipital cortex; TC, temporal cortex; ACC, anterior cingulate cortex; PCC, posterior cingulate cortex; PHG, parahippocampal gyrus; L, left; R, right. Error bars represent SEM. Group differences significant at p<0.001 are marked with asterisks (*).
In addition, by resetting the threshold at an exploratory probability level of p<0.005 (fig 2B), bilateral METglc differences emerged in the medial frontal gyrus (BA 8), the occipital lobe (BA 18), the ACC (BA 32/24), and the superior temporal lobe (STL) (BA 38). Unilateral group differences, present only in the left hemisphere, were found in the posterior cingulate cortex (PCC, BA 23) and the parahippocampal gyrus (PHG, BA 36). Direct comparisons within these brain regions showed that e4/e4 patients have lower METglc in the frontal cortex, bilaterally, and in the left PCC and PHG, compared with the e3/e4 carriers and the e4 non-carriers both. Conversely, both the e4/e4 and the e3/e4 carriers have lower METglc within the STL, ACC, and occipital lobe, bilaterally, compared with the e4 non-carriers (fig 2C). Although these additional findings have only an exploratory validity, they show that the metabolic differences between AD subgroups in relation to ApoE4 dose involve brain areas adjacent to those typically hypometabolic in AD in comparison with normal controls (fig 3).

Statistical parametric maps (SPMs) showing (A) areas of significant METglc decrease in AD patients compared with control subjects (p<0.001, corrected for cluster extent); (B) areas of significant METglc differences between ApoE4 non-carriers, e3/e4 and e4/e4 allele carriers (p<0.005, uncorrected); (C) SPMs resulting from (A) (red) and (B) (green) are superimposed onto the right lateral, posterior, and superior surfaces of a spatially standardised volume rendered MRI image.
DISCUSSION
The present FDG-PET study shows that different metabolic phenotypes can be detected with a voxel based statistical approach in a population of mild AD patients, related to the inherited dose of the ApoE e4 allele.
This work provides two main findings. Compared with the control subjects, all AD genotypic subgroups had equivalent patterns of METglc reductions in the precuneus, posterior cingulate, parietotemporal, and frontal regions. In contrast, AD subgroups presented significant metabolic differences in the cortical and limbic areas adjacent to those hypometabolic in AD patients, compared with controls (fig 3). Within those areas, the e4/e4 carriers had greater METglc reductions compared with the e4 non-carriers, whereas the e3/e4 carriers had variable reductions depending on the brain area considered.
When compared with normal controls, all AD subgroups presented with similar patterns of METglc reductions within the precuneus, posterior cingulate, parietotemporal, and frontal association cortex. These regions are typically affected in AD and the rate of metabolic impairment was found to be strongly related to the degree of cognitive impairment.8 As showed by Herholz et al,8 all regions related to AD severity are already affected in very mild AD, suggesting that all vulnerable areas are already affected to a similar degree at disease onset. Consistently, the present study showed that AD subgroups comparable for both disease severity (as assessed through MMSE scores) and mean age at onset have equivalent spatial distribution of metabolic decreases within these areas.
These results are consistent with previous ROI studies on AD patients that reported no difference between genotypic subgroups within the precuneus, posterior cingulate, parietotemporal, and frontal areas.17–19 Furthermore, Hirono et al20 provided evidence that the hypometabolism within the parietotemporal and medial temporal areas varies between early onset e3/e3 and e4/e4 carriers, but that these differences are lost for late onset patients.
Together with previous research, the present results suggest that at the onset of AD cognitive symptoms, possible METglc differences between the ApoE genotype groups are no longer detectable within these mainly hypometabolic areas in AD. In a 2 year follow up study, Lehtovirta et al16 reported that the e4/e4 carriers had greater rCBF reductions in those areas compared with e3/e4 carriers and e4 non-carriers, thus providing evidence that parieto-occipital rCBF differences can still be detected in clinical AD patients by longitudinal assessments.
The comparison between the AD subgroups showed that both e3/e4 and e4/e4 carriers have lower METglc within the pre-central areas compared with e4 non-carriers, whereas within the occipital and ACC areas the e4/e4 carriers have lower METglc compared with both e4 non-carriers and e3/e4 carriers. In addition, by resetting the threshold at a slightly lower probability level (p<0.005), lower METglc in the e4/e4 compared with the non-carriers was found in several cortical and limbic areas surrounding the regions referred to above and filling the gaps between these and the typically hypometabolic regions in AD (fig 3). These additional regions include the medial frontal gyrus, middle occipital lobe, ACC, superior temporal lobe, posterior cingulate cortex, and parahippocampal gyrus. Although these findings have only an exploratory validity, they show that ApoE related phenotypic differences are evident within the brain areas adjacent to those typically hypometabolic in AD (fig 3).
It should be noted that the pre-central and occipital regions are usually metabolically spared in AD compared with normal controls.8 Indeed, the present findings are derived from the comparison between genetically different AD patients rather than with the controls, and therefore suggest that these regions express a METglc impairment in an e4 dose related fashion that is still below the detection threshold compared with normal controls. These findings could reflect a relative preservation of FDG uptake in the e4 non-carriers and, in turn, a relatively diffuse disruption in the e4 carriers, consistent with genetic data showing a protective effect of the e2 and e3 alleles, and an e4 related pathological function in AD.9,10 The present results are compatible with the hypothesis that the e4 allele plays a disruptive role in METglc. Indeed, FDG-PET studies on cognitively normal elderly showed that, compared with non-carriers of the e4 allele, e4 heterozygotes and homozygotes had abnormally low METglc in the same brain areas as clinical AD patients. Additionally, the METglc decline continued over time and aggravated in the e4 carriers.5,6,13,14 Concurring with these findings, the present study shows that increasing ApoE4 load enhances the AD related METglc disruption, with a subtle proportional involvement still undetectable compared with normal controls. This effect could be better investigated through a voxel by voxel analysis rather than with the ROI approach, because of the small size and the unexpected anatomical position of the brain regions involved. Future studies with different samples of AD patients are needed to validate these exploratory findings.
Furthermore, we found that the influence of the e4 allele dose on METglc is regionally selective. This effect has not been explored so far because the phenotypic differences occur within brain areas that were not examined in previous ROI studies.16–19 Indeed, the present study shows that at least one copy of the e4 allele is related to METglc reductions within the ACC, STL, and occipital lobe, whereas a double e4 allele dose is associated with lower METglc in the frontal cortex, PCC, and PHG. The mechanisms by which the different polymorphisms of the ApoE affect cerebral functioning are currently under investigation.1 Future studies are needed to evaluate the biological factors through which the different genotypes are implicated in the pattern of regionally specific disruption.
Lastly, the present findings provide evidence for an e4 related METglc decline in the anterior cingulate cortex (ACC). This finding is consistent with recent neuroimaging reports that have implicated the ACC in AD onset,29,30 mainly because of its participation in the retrieval of episodic memories and in attentive processes,31–33 although independently of the ApoE genotype. Although there is evidence of a decline in cognitive abilities related to the e4 allele,34–36 further studies are needed to assess whether this effect could be associated with an ACC METglc reduction. Moreover, the parahippocampal gyrus, including the entorhinal cortex, presented a METglc reduction related to the ApoE genotype. This result is consistent with the findings by De Leon et al,7 who showed how lower METglc levels in the entorhinal cortex of normal elderly could predict conversion to mild cognitive impairment, with the e4/e4 carriers having the greater baseline declines.
In the present study, a correction for cortical atrophy was not performed. Nonetheless, most studies that have performed voxel based atrophy correction of resting glucose metabolism have reported a relative independence of METglc reduction from brain atrophy.37 Moreover, additional information could be provided by quantitative rather than relative METglc measurements.
Future studies are necessary to investigate whether the combination of genetic data and neuroimaging assessment could help to outline possible target groups for preventive procedures, and to design rational strategies for the treatment of AD.
Acknowledgments
This study was conducted by the Network for Efficiency and Standardisation of Dementia Diagnosis with support from the European Commission (Framework V; European Union grants QLK-6-CT-1999–02178 and QLK-6-CT-1999–02112). Work at Florence was also supported by the Ministero dell’Università e della Ricerca Scientifica e Tecnologica, by Telethon Italia Fondazione ONLUS (grant no E.0980), and by Regione Toscana, Progetto Ministero della Sanita’, “Diagnosi Tempestiva e Differenziale della Malattia di Alzheimer. Uso delle Tecnologie avanzate”. Work at CRC Liege was also supported by grants from FNRS and FMRE, Belgium. The authors gratefully acknowledge Professors E Salmon and V Holthoff for kindly providing part of the database of healthy controls and Dr S Minoshima for allowing the use of NEUROSTAT software. We would like to thank Dr M Matteini for the help in patient management during scans, Drs E Cellini and S Bagnoli for their contribution in genetic assessments, and Professor A R Formiconi and Mr G Comis for their assistance in image analysis.
REFERENCES
Footnotes
-
Competing interest: none declared