Article Text

Abstract
Background: Neurofilament phosphoforms (Nf) are principal components of the axoskeleton released during axonal injury. Cerebrospinal fluid (CSF) levels of Nf phosphoforms might be useful surrogate markers for disability in multiple sclerosis (MS), aid in distinguishing clinical subtypes, and provide valuable prognostic information.
Method: Thirty four patients with MS were included in a three year follow up study along with 318 controls with other non-inflammatory neurological diseases. CSF levels of two Nf heavy chain (NfH) phosphoforms (NfHSMI35, NfHSMI34) were quantified at baseline and three year follow up using new ELISA techniques. Levels of NfH phosphoforms, the degree of phosphorylation (NfHSMI34:NfHSMI35 ratio), and changes in NfH levels between baseline and follow up (ΔNfH) were related to the clinical phenotype (RR or SP/PP), to three clinical scales (Kurtzke’s EDSS, ambulation index (AI), and nine hole peg test (9HPT)), and to progression of disability.
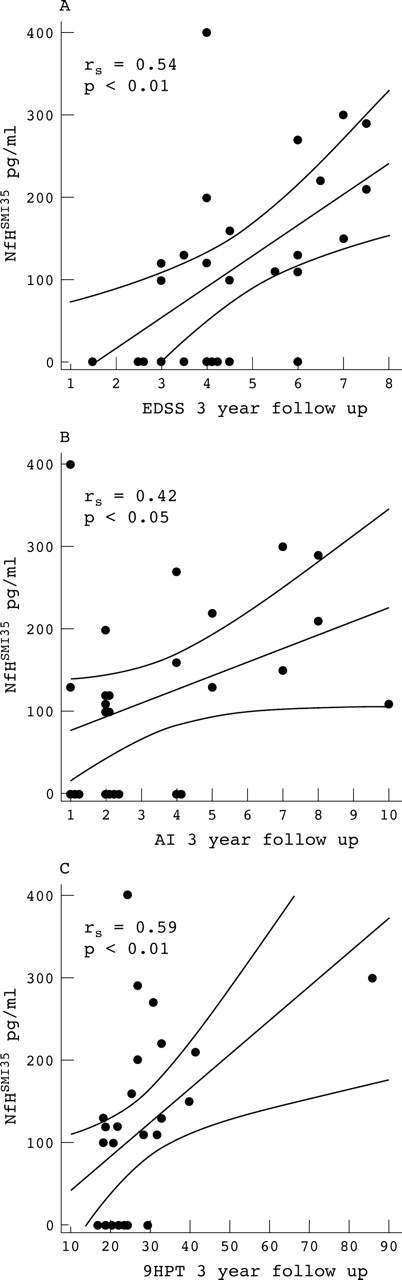
Results: A significantly higher proportion (59%) of patients with SP/PPMS experienced an increase in NfHSMI35 levels between baseline and follow up compared with those with RRMS (14%, p<0.05). CSF NfHSMI34 levels at baseline were higher in patients with SP/PP (11 pg/ml) compared with RR (7 pg/ml, p<0.05) and NfHSMI35 levels were higher at follow up in SP/PP (129 pg/ml) compared with levels below assay sensitivity in RR (p<0.05). NfHSMI35 correlated with the EDSS (rs = 0.54, p<0.01), the AI (rs = 0.42, p<0.05), and the 9HPT (rs = 0.59, p<0.01) at follow up.
Conclusion: The increase in NfH during the progressive phase of the disease together with the correlation of NfHSMI35 with all clinical scales at follow up suggests that cumulative axonal loss is responsible for sustained disability and that high NfHSMI35 levels are a poor prognostic sign.
- 9HPT, nine hole PEG test
- AI, ambulation index
- BSP, brain specific proteins
- CSF, cerebrospinal fluid
- CTRL, control
- EDSS, Expanded Disability Status Scale
- ELISA, enzyme linked immunosorbent assay
- IEF, isoelectric focusing
- MS, multiple sclerosis
- Nf, neurofilament
- NfH, neurofilament heavy chain
- NfHSMI34, NfH detected with SMI34 antibody
- NfHSMI35, NfH detected with SMI35 antibody
- NfL, neurofilament light chain
- OND, other neurological diseases
- PP, primary progressive
- RR, relapsing remitting
- SP, secondary progressive
- neurofilament phosphoforms
- multiple sclerosis
- prognosis
- disease subtype
- disability
- axonal injury
Statistics from Altmetric.com
- 9HPT, nine hole PEG test
- AI, ambulation index
- BSP, brain specific proteins
- CSF, cerebrospinal fluid
- CTRL, control
- EDSS, Expanded Disability Status Scale
- ELISA, enzyme linked immunosorbent assay
- IEF, isoelectric focusing
- MS, multiple sclerosis
- Nf, neurofilament
- NfH, neurofilament heavy chain
- NfHSMI34, NfH detected with SMI34 antibody
- NfHSMI35, NfH detected with SMI35 antibody
- NfL, neurofilament light chain
- OND, other neurological diseases
- PP, primary progressive
- RR, relapsing remitting
- SP, secondary progressive
Axonal pathology remains the “Achilles heel” of neurology. New insights from recent studies into the “axonal death cascade”1 in multiple sclerosis (MS) are that a high number of transected axons are already present in acute lesions2,3 (independent of demyelination4), in patients with a short clinical course,2,5 and as a result of electrical activity in a hostile microenvironment.6 Axonal loss results in atrophy of the spinal cord,7 cerebellum,8 and cortex,9 all of which correlate with disability.7–9 In vivo quantification of axonal damage is a key tool for monitoring and understanding axonal pathology in complex diseases such as MS.
Neurofilaments (Nf) constitute a major component of the axoskeleton and are promising candidates for quantification of axonal damage because axonal transection results in disintegration of the distal axon membrane and Nf breakdown.10,11 Nf are released into the adjacent compartment—that is, the cerebrospinal fluid (CSF), where they can be measured.12,13
This prospective study was stimulated by three questions.14,15
-
Can clinical subtypes of MS be distinguished on the basis of axonal damage (disease heterogeneity16)?
-
Does disability correlate with markers of axonal pathology?
-
Can we predict loss of function by using biomarkers for axonal injury?
METHODS
The present study was approved by the local ethics committees, and written informed consent was obtained from all patients.
Patients
A total of 34 patients from a previously reported cohort17,18 with clinically definite MS19 were followed up after three years. A second CSF sample was available for 29 patients at the time of study. The patients with MS were classified as having relapsing remitting (RR, n = 11), or progressive (n = 23, SP/PP) disease.20 For the CSF analysis patients with primary (PP) and secondary (SP) progressive disease were pooled because of small numbers. However, we will also present a detailed subgroup analysis for classification of patients with RR (n = 10), SP (n = 16) and PP (n = 3) MS at baseline and at follow up. Nine patients had been started on treatment with interferon beta (IFNβ) since recruitment in 1996. The control group consisted of 318 patients with other non-inflammatory neurological diseases (OND) from the National Hospital of Neurology and Neurosurgery, London, UK. Restricted sample volume meant not all assays could be performed on each sample and the numbers available for each comparison are presented in table 1.
Baseline characteristics of the patients
Clinical assessment
All patients were assessed within one week of each lumbar puncture using:
-
the Expanded Disability Status Scale (EDSS)21: ranging from 0 (normal) to 10 (death due to multiple sclerosis)
-
an ambulation index (AI): ranging from 0 (no impairment) to 9 (restricted to wheelchair without independent transfer)
-
the nine hole peg test (9HPT) measuring upper limb motor function.22
The patients were classified as clinically advancing if they worsened on the EDSS scale by at least 1 point for an EDSS <5.5 or at least 0.5 point for an EDSS ⩾5.5.
Assays
Samples of CSF were obtained by routine lumbar puncture. Aliquots of CSF were stored at −70 °C until assayed. Levels of NfH phosphoforms were quantified using an in-house enzyme linked immunosorbent assay (ELISA) technique based on commercially available antibodies.23 This ELISA has been optimised for the capture antibody SMI35 which recognises a range of NfH phosphoforms (170 kDa, pI 6.2 to 210 kDa, pI 5.1). In contrast, the capture antibody SMI34 only recognises extensively phosphorylated NfH.24 Unfortunately non-phosphorylated Nf are susceptible to proteases,24–26 of which the CSF is a rich source. For this reason NfHSMI32 was not measured in the present study and a ratio of NfHSMI34 to NfHSMI35 was used to approximate the phosphorylation status (see below). Albumin in CSF and serum was determined by standard Laurell “rocket” electroimmunoassay.
Data analysis
All statistical analyses and graphs were done using SAS software (version 8.2, SAS Institute, Inc, Cary, NC). Because of non-Gaussian distribution, median values and the 25–75% interquartile ranges (IQR) were calculated. Independent variables were compared using the non-parametric two sample exact Wilcoxon’s rank sum test. If significance was based on small numbers the results were checked by the one tailed Fisher’s exact test. The linear relationship between continuous variables was evaluated using the Spearman correlation coefficient. Multiple correlations were corrected using the Bonferroni method. Linear regression analysis was performed using the least squares method.
The change in NfH levels between baseline and follow up was expressed as the difference:
Δ NfH = NfHfollow up−NfHbaseline.
A positive number indicated an increase in the NfH level at follow up. Because the interassay coefficient of variation for NfH is 10.6%, only an increase of at least 11% was considered for further statistical analysis.23
The phosphoform ratio is an estimate of the degree of phosphorylation and was expressed as a cross-sectional measure:
Ratio = (NfHSMI34/NfHSMI35)×10.
A decrease in the ratio indicated an overall reduction in the level of phosphorylation. Values with zero denominator (or NfH at baseline and follow up below assay sensitivity) could not be used for calculations and were excluded from this analysis.
RESULTS
The demographic data at baseline are shown in table 1. As expected at baseline, EDSS, AI, and 9HPT were worse in patients with SP/PP disease than in those with RR disease. The CSF levels of NfHSMI35baseline were higher in patients with OND than in those with MS (p<0.001, table 2). The CSF levels of NfHSMI34baseline were similar in both groups. No correlations were found between the Nf phosphoforms or their ratio and age, disease duration, time from last relapse, relapse frequency, or the CSF albumin:serum albumin ratio (data not shown). The shortest relapse free time was three months at baseline in two patients. At follow up one patient with SP/PPMS experienced a superimposed relapse two weeks prior to the CSF sampling. There was no correlation with time from relapse in patients with SP/PPMS or RRMS at either sampling point.
CSF levels and ratio of NfH phosphoforms, EDSS, AI, and 9HPT at baseline in patients with MS and OND (controls), and CSF levels and ratio of NfH phosphoforms, EDSS, AI, and 9HPT, and change over time (ΔNfH) at follow up in patients with MS. Values are median (interquartile range)
Axonal damage accumulates in SP/PP disease
A significant increase in NfHSMI35 from baseline to follow up was observed in a higher proportion of patients with SP/PPMS (13/22, 59%, fig 1) when compared with patients with RRMS (1/7, 14%, p<0.05). At follow up the median CSF level of NfHSMI35 was higher for patients with SP/PP disease compared with patients with RR disease (see table 2, p<0.05).

(A) CSF NfHSMI35 levels and (B) CSF NfHSMI34 levels in patients with relapsing remitting (RR) and secondary/primary progressive (SP/PP) forms of multiple sclerosis (MS). A significantly higher proportion of patients with SP/PPMS (13/22) had an increase in CSF NfHSMI35 levels between baseline and follow up (straight lines) when compared with patients with RRMS (1/7, p<0.05, Fisher’s exact test).
An increase of NfHSMI34 levels was observed in a similar proportion of patients with RR (5/7, 71%) and with SP disease (15/22, 68%). The CSF levels of NfHSMI34baseline were higher in patients with SP/PP than with RR disease (table 2, p<0.05). The proportion of patients with RR (5/7, 71%) in whom NfHSMI34 increased was higher than the proportion with an increase in NfHSMI35 (1/7, 14%, p<0.05). The NfHSMI34:NfHSMI35 ratio decreased in 6/7 (86%) of patients with RR and 12/22 (55%) with SP disease. Neither of these comparisons reached statistical significance.
Axonal injury correlates with disability
NfHSMI35 levels correlated with all three clinical scales at follow up (fig 2). The correlation was strongest for the 9HPT (rs = 0.59, p = 0.001), followed by the EDSS (rs = 0.54, p <0.01), and the AI (rs = 0.42, p<0.05). The correlation with the AI was lost after Bonferroni correction. One outlier was observed for the 9HPT (fig 2C), but its exclusion did not change the significance of the correlation (rs = 0.55, p<0.01). The NfH phosphoform ratio correlated with the EDSS (rs = 0.52, p<0.05) at follow up, but this significance was lost after the Bonferroni correction. No significant correlation was found between either NfH phosphoform and the change in EDSS, AI, or 9HPT over the three year period (data not shown). At baseline, no such correlations were found after Bonferroni correction for either of the NfH phosphoforms or their ratio.

Correlation between the CSF NfHSMI35 levels and (A) the Expanded Disability Status Scale (EDSS), (B) the ambulation index (AI), and (C) the 9HPT (nine hole peg test; log transformed scale) at follow up.
Axonal injury and prognosis
The median CSF NfHSMI35 level (107 pg/ml) of patients with MS who progressed on the EDSS scale within three years showed a tendency to be higher compared with the median level of those who remained stable (38 pg/ml). However, this difference did not reach statistical significance for either the total MS cohort or the clinical subtypes (table 3). However, using an arbitrary cut-off level of 20 pg/ml (assay sensitivity) on the baseline cohort, the positive predictive value of high NfHSMI35 levels for predicting progression of patients on the EDSS scale within three years was 100% for RRMS and 20% for SP/PPMS with specificity of 100% and 20% and sensitivity of 87.5% and 75%, respectively.
CSF levels and ratio of NfH phosphoforms for clinically progressive versus stable patients at baseline. Values are median (interquartile range)
Three patients who had RR disease converted to SP disease in the three year observation period. These patients had a higher median CSF NfHSMI35baseline level (123 pg/ml) when compared with non-converting RR patients (49 pg/ml). Again this difference did not reach statistical significance.
Patients treated with IFNβ had a lower median EDSS at baseline (2.0 v 5.5; p<0.05) and follow up (4.0 v 4.5; p<0.05) and were less progressive (improvement by a median of 1.5 points on the EDSS v no change; p<0.05) compared with untreated patients. The patients treated with IFNβ had lower CSF NfHSMI34baseline levels (7 pg/ml) compared with non-treated patients (11 pg/ml, p <0.01). No such differences were found for NfHSMI35baseline or the NfH phosphoform ratio.
Subgroup analysis
Since there are differences in pathogenesis between SPMS and PPMS, particularly with reference to the degree of inflammation, CSF levels of NfHSMI35, NfHSMI34, and their ratio were also examined for all individual subgroups.
At baseline, there was a significant difference between these groups for NfHSMI34 (F2,26 = 5.00, p<0.05). The post hoc analysis revealed that CSF NfHSMI34 levels were higher in patients with PP disease (mean 26.6 pg/ml) compared with patients with SP (mean 10.19 pg/ml, p<0.01) or RR disease (mean 9.30 pg/ml, p<0.01).
At follow up no such difference was found, probably due to the small numbers and therefore no post hoc analysis was performed.
DISCUSSION
The present study:
-
provides evidence that accumulation of axonal damage as estimated by serial CSF NfHSMI35 levels predominates in SP/PPMS
-
reveals a correlation between CSF levels of NfHSMI35 and the degree of disability on three clinical scales (EDSS, AI, 9HPT)
-
failed to demonstrate that CSF NfH phosphoforms might predict the development of new disability in patients with MS.
We interpret these findings on the basis of the epidemiologically supported hypothesis that axonal damage is a gradual cumulative process during the course of the disease27,28 and that loss of neurological function is a direct consequence of axonal injury.2,14,15
Firstly, NfHSMI35 levels increased from baseline to the three year follow up sampling in about half of our patients with MS. A significantly higher proportion of these patients had SP/PP than RR disease. Additionally, the median NfHSMI35follow up level was significantly higher in SP/PP rather than in RR disease. The marked increase of NfHSMI34 levels suggests that NfH phosphorylation may increase with disease duration. This interpretation contrasts with the consistent immunocytochemical observation that injured and demyelinated axons stain for non-phosphorylated NfH (NfHSMI32).2,29–32 However, none of these studies presented quantitative data comparing the number of axons staining for phosphorylated versus non-phosphorylated NfH. A further complicating factor is that proteolytic enzyme activity is a prominent feature of the MS plaque33,34 and potentially affects the levels, particularly of non-phosphorylated NfH, which is susceptible to proteolysis.24–26 To address this question we are currently analysing the quantitative distribution of NfH phosphoforms (NfHSMI32, NfHSMI34, and NfHSMI35) in microdissected brain tissue homogenates from a previously published cohort.17,35,36 An increase in NfH phosphorylation supports our finding and can be explained by targeted phosphorylation of the KSP repeats of the NfH and NfM tail domains by ERK1/2.37 Fibrin upregulates ERK1/238 and has shown to be deposited on injured axons.35,36,39 Additionally the mitogen activated protein (MAP) kinases SAPKs and ERK1/2 are activated by glutamate40–44 which in turn leads to Ca influx, slowing of axonal Nf transport, and increased Nf phosphorylation.45,46 Glutamate toxicity is an important pathological feature in MS, metabotropic glutamate receptor group I alpha is upregulated on axons in MS29 and experimental treatment with the AMPA/kainate antagonist NBQX reduces axonal damage in experimental autoimmune encephalomyelitis.30 The present CSF results are also consistent with the postmortem observation that axonal damage increases with time in SP/PPMS patients,47 with additional support from brain imaging48 and epidemiological studies.28
Secondly, we found a correlation between CSF NfHSMI35 and three clinical scales. This finding indirectly confirms two previous reports on a different Nf subunit (the 68 kDa light chain, NfL).12,13 Lycke et al reported CSF NfL correlated with the EDSS at baseline (r = 0.27) and follow up (r = 0.34) in patients with RRMS.12 Semra et al found CSF NfL correlated with the EDSS (r = 0.41) in patients progressive MS.13 However, no such correlations were found at baseline in our original study,18 the present follow up cohort, or a recent study on patients with RRMS and SPMS.49 Because clinically, some of our patients with SP/PP disease improved a degree of disability at baseline, it is likely that conduction block and demyelination which are, in contrast to axonal loss, reversible, contributed to the deficit.
Thirdly, a tendency for higher median CSF NfHSMI35baseline and NfHSMI34baseline levels were observed in those patients with MS who progressed clinically on the EDSS scale. This was most marked for patients with RR disease and suggests that axonal damage during the course of MS is a poor prognostic feature. However, the study failed to show statistical difference. The high positive predictive value and sensitivity suggest that this might be due to the small sample size. It is important to note that axonal loss is not the dominant pathological feature in MS compared with other neurological diseases.23,50 Nevertheless, the demonstrated slow accumulation of axonal loss seems a logical explanation for the development of sustained disability in the progressive course of the disease.
When interpreting the present data one needs to consider that the patient group is population based and the numbers small. Clinically, there was no significant change in the EDSS of the patients with SP/PPMS within three years. This represents a benign course compared with the more rapid progression observed in other cohorts of patients selected from hospital populations. Additionally the low median CSF NfHSMI35 level of the RRMS cohort at follow up would suggest that these patients might have a benign disease course. The results must be interpreted with caution and will need to be cross-validated in other longitudinal studies with different cohorts of patients.
Taking all these observations together, the results of the present study are in accordance with the current concept of progressive axonal degeneration in MS which is based on evidence from animal,51,52 human postmortem,2,3,5,36,47,53 magnetic resonance spectroscopy,54 magnetic resonance imaging,7–9,55 and epidemiological studies.28,56
In conclusion, the findings of our prospective three year study support the idea that CSF NfH phosphoforms might be valuable surrogate markers which have the potential to be used as new secondary outcome measures in trials of MS treatment.
REFERENCES
Footnotes
-
This study was devised as part of a study into biomarkers for neurodegeneration supported by the Multiple Sclerosis Society of Great Britain and Northern Ireland (AP, GG), the BR Kirk Fund of the Institute of Neurology (AP, ET), and the Multiple Sclerosis Society of the Netherlands (JE).
-
Competing interests: none declared
-
During the review process of this paper a separate study on the cerebrospinal neurofilament phosphoforms (NfHSMI34 and NfHSMI35) was published by