Article Text

Abstract
Purpose The associations between vitamin D and MRI measures of brain tissue injury have not been previously investigated in multiple sclerosis (MS). This research evaluates the significance of vitamin D and its active metabolites in brain tissue injury and clinical disability in MS patients.
Methods The study population consisted of 193 MS patients (152 women and 41 men; mean age 46.1 (SD 8.4) years; disease duration 13.8 (SD 8.4) years). Serum levels of 25-hydroxyvitamin D3 (25(OH)VD3), 25-hydroxyvitamin D2 (25(OH)VD2), 1α, 25-dihydroxyvitamin D3 (1, 25(OH)2VD3) and 24(R), 25-dihydroxyvitamin D3 (24, 25(OH)2VD3) were measured using a novel capillary liquid–chromatography–mass spectrometry method. Disability was assessed with the Expanded Disability Status Scale (EDSS) and the MS Severity Scale (MSSS). MRI measures included T2 lesion volume (LV), T1-LV and brain parenchymal fraction. The associations between deseasonalised levels of vitamin D metabolites and clinical and MRI measurements were assessed using regression analyses.
Results Lower deseasonalised levels of total 25(OH)VD (p=0.029), 25(OH)VD3 (p=0.032) and 24, 25(OH)2VD3 (p=0.005) were associated with higher MSSS. Similarly, lower deseasonalised levels of 24, 25(OH)2VD3 (p=0.012) were associated with higher EDSS. Higher values of the 25(OH)VD3 to 24, 25(OH)2VD3 ratio were associated with higher MSSS (p=0.041) and lower brain parenchymal fraction (p=0.008).
Conclusions Vitamin D metabolites have protective associations with disability and brain atrophy in MS. In particular, the results indicate strong associations for the 24, 25(OH)2VD3 metabolite, which has not been extensively investigated in MS patients.
Statistics from Altmetric.com
Introduction
Multiple sclerosis (MS) is a degenerative, inflammatory disease of the central nervous system that causes demyelination, sclerotic plaques and atrophy. The aetiology of MS is complex and involves multiple genes and interactions with environmental factors1–3 that can potentially cause the heterogeneity found in histopathological studies of MS lesions.4 5 In epidemiological studies, vitamin D, immune responses to Epstein–Barr virus and cigarette smoking are the most compelling environmental factors associated with the risk of developing MS.
Vitamin D production in the skin during sun exposure may potentially explain the increased prevalence of MS at higher latitudes. Vitamin D insufficiency is frequent in MS patients6 and women who took vitamin D supplements were 40% less likely to develop MS than those who did not.7 A large scale prospective study found that young adults with the highest levels of 25-hydroxyvitamin D had a 62% reduction in MS risk compared with their counterparts with the lowest levels.8
Vitamin D3 (VD3) metabolites modulate the immune system to favour anti-inflammatory responses.9 Immune cells have the enzymes necessary to produce 1, 25 dihydroxy VD3 (1, 25(OH)2 VD3),10 which has been shown to promote regulatory T cell development.11 Compromised regulatory T cell activity is believed to be critically involved in the MS disease process and T regulatory cell percentages in MS patients are associated with 1, 25(OH)2 VD3: 25(OH)VD3 ratio.12
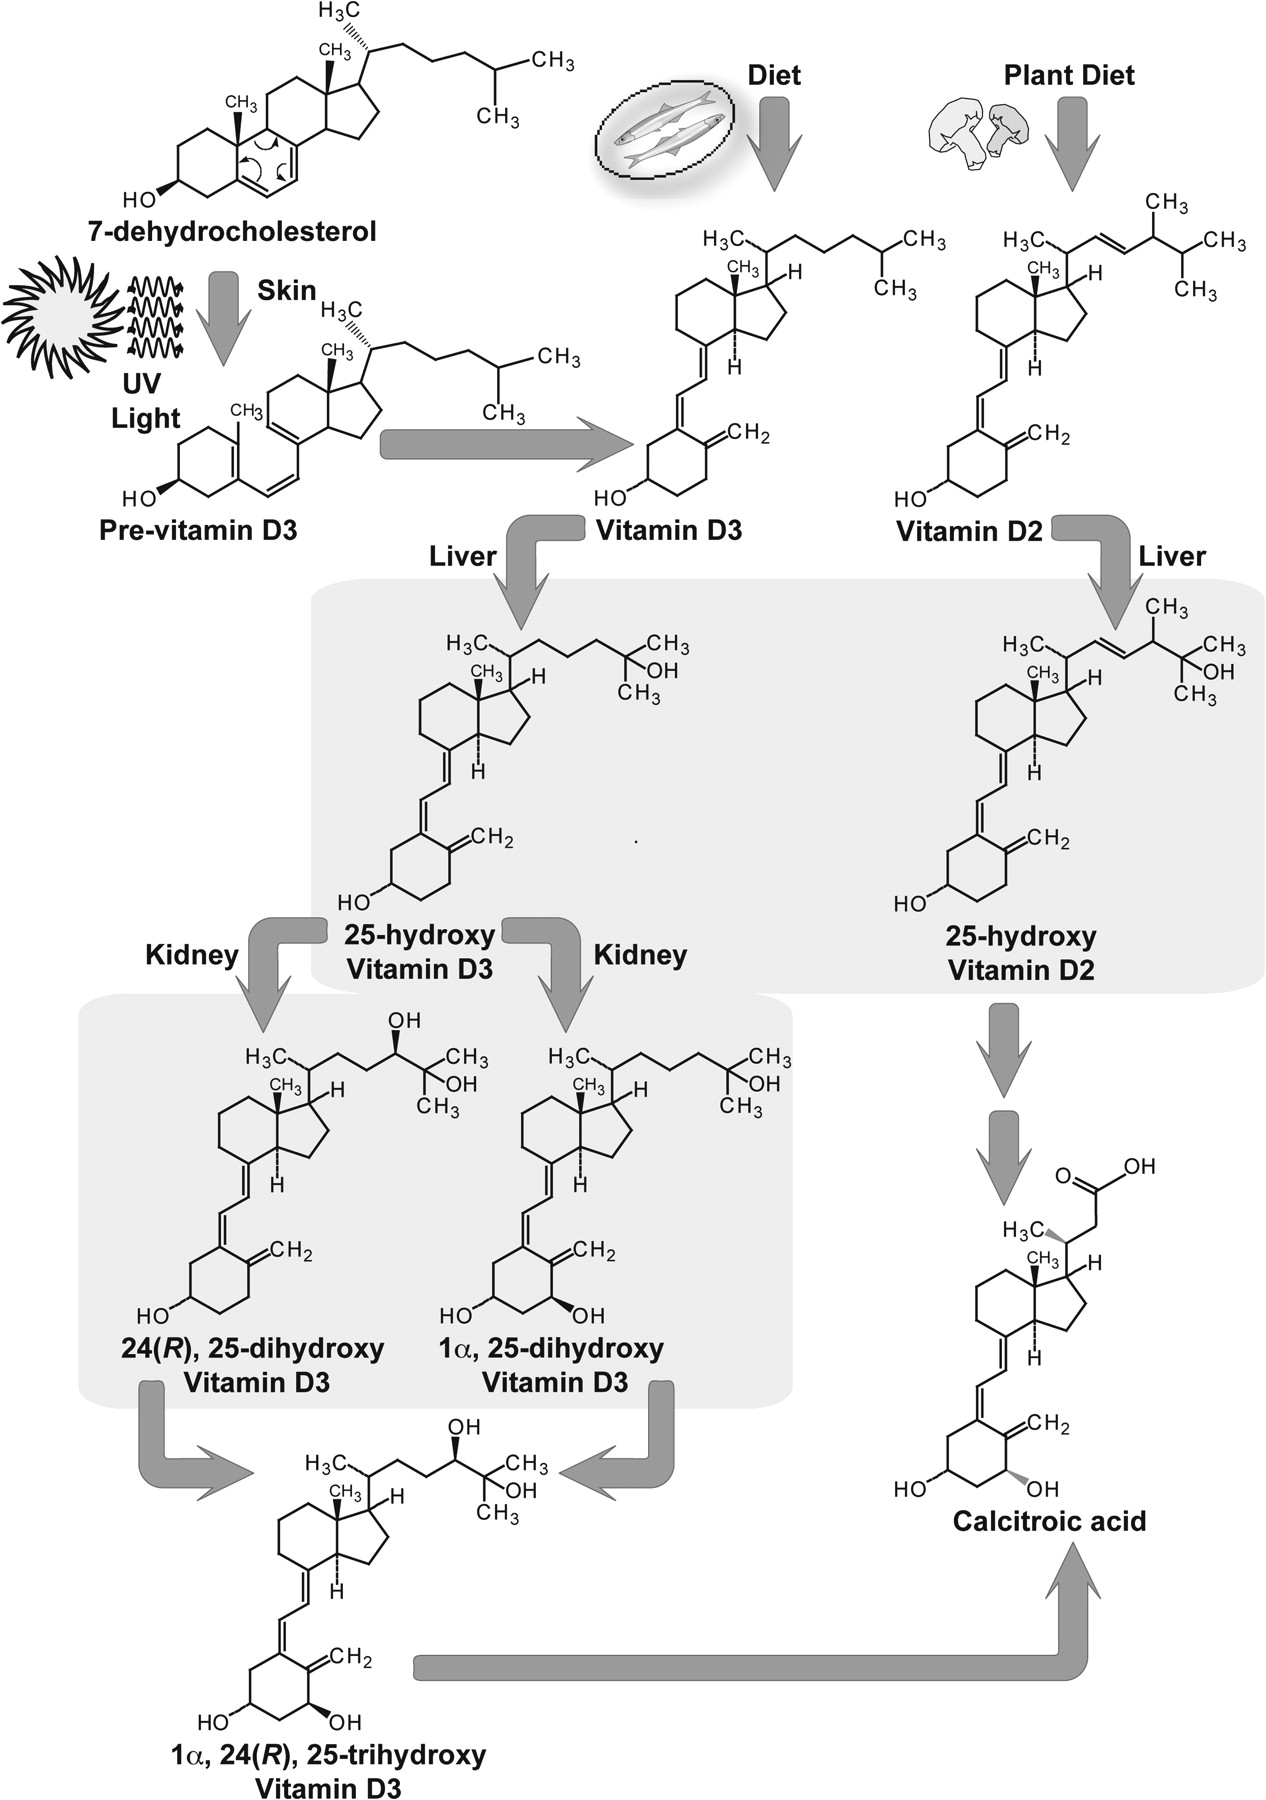
Ultraviolet light in sunlight converts 7-dehydrocholesterol to VD3 in the skin. VD3 undergoes metabolism to 25-hydroxy VD3 (25(OH)VD3) in the liver and is further transformed to the active form, 1, 25(OH)2VD3, in the kidney (figure 1). The 1, 25(OH)2VD3 is toxic at higher concentrations and is converted to 24, 25 dihydroxy VD3 (24, 25(OH)2VD3).13 Vitamin D2 (VD2) is obtained from dietary sources. The key metabolites in the vitamin D pathway have not been systematically investigated in MS patients because of analytical challenges associated with their measurement. Furthermore, the associations between MRI measures and vitamin also have not been extensively investigated. In this paper, we leverage new sensitive and selective mass spectrometric assays for measuring serum 25(OH)VD3, 25(OH)VD2, 1, 25(OH)2VD3 and 24, 25(OH)2VD3 levels14 to investigate the associations of vitamin D metabolites to clinical and MRI measures in MS.
The vitamin D metabolic pathway. Endogenous vitamin D production is dependent on ultraviolet radiation. Sunlight interacts with 7-dehydrocholesterol in skin to produce pre-vitamin D3, which is consecutively converted to vitamin D3, 25(OH)VD3, 1, 25(OH)2VD3, 24, 25(OH)2VD3, 1, 24, 25(OH)3VD3 and other metabolites. Similar vitamin D metabolism pathway occurs to vitamin D obtained from dietary sources such as fatty fish, mushroom and milk. The chemical structures of vitamin D derivatives: 25(OH)VD3, 25(OH)VD2, 1, 25(OH)2VD3 and 24, 25(OH)2VD3. Vitamin D metabolites are seco-steroids in which one ring is broken. Vitamin D2 differs from vitamin D3 in the presence of additional methyl group on C24 and double bond between C22 and C23. Formation of 25(OH)VD3 and 25(OH)VD2 occurs in the liver. Formation of 1, 25(OH)2VD3, 24, 25(OH)2VD3 occurs in the kidney.
Materials and methods
Study population
Two hundred and thirty-six MS patients meeting study inclusion/exclusion criteria were initially identified from among patients participating in an ongoing prospective natural history study at the Baird Multiple Sclerosis Center.
The study population included patients aged >18 years, with clinically definite MS according to the McDonald criteria,15 16 a relapsing–remitting (RR-MS) or secondary progressive MS (SP-MS) disease course17 and an available MRI assessment performed ±90 days from the blood sample.
Patients with clinically isolated syndrome, primary progressive MS and neuromyelitis optica were excluded. Additional exclusion criteria were: any relapse with corticosteroid treatment in the 1 month prior to blood sampling or MRI examination, pre-existing medical conditions known to be associated with brain pathology (eg, neurodegenerative disorders) and insufficient quality of the MRI scan for quantitative analysis.18
Of the 236 patients enrolled, 41 failed to indicate race on their baseline demographic questionnaire. As vitamin D levels have been shown to differ considerably by skin colour/race, the final study population (n=193) was limited to those for whom self-reported race was available. A comparison of the groups who did and did not report race showed no significant differences in demographic or clinical characteristics.
Blood samples were obtained from patients at the time of their baseline clinic visit. Serum was frozen at −80°C until analysis for vitamin D metabolites.
The study data were obtained under a protocol approved by the Human Subjects Institutional Review Board of the University at Buffalo. Written informed consent was obtained from all subjects.
Analysis of vitamin D pathway
The metabolites of interest were 25(OH)VD3, 25(OH)VD2, 1, 25(OH)2VD3 and 24, 25(OH)2VD3 (figure 1). Liquid chromatography–tandem mass spectrometry (LC-MS/MS) methods with stable isotope labelled internal standards were the methods of choice given their high sensitivity and selectivity for discriminating between closely related metabolites. Stable isotope labelled internal standards were included to address the challenges of reproducibility issues associated with immunoassay methods. Additionally, we made key improvements. Briefly, the method involves derivatisation with 4-phenyl-1, 2, 4-triazoline-3, 5-dione (PTAD) followed by a novel solid phase extraction (SPE) prior to microflow capillary LC-MS/MS analysis (μLC/MS/MS). The protocol is described in the supplementary material available online.
The detailed methodology and validation of our assay and preliminary comparisons of analyte levels in MS patients and controls have been published previously.14
MRI acquisition and analysis
Image acquisition
Quantitative MRI analysis was available for 182 of 193 patients at baseline (scans from 11 patients were not analysable scans due to motion artefacts, etc). Patients underwent brain MRI on a 1.5 T GE Signa Excite HD 12.0 Echospeed 8 channel scanner (General Electric, Milwaukee, Wisconsin, USA) within approximately 30 days from the blood draw (mean±SD=29.3±25.1 days, median=23 days). MRI sequences included multiplanar dual fast spin echo proton density and T2 weighted image (WI), fluid attenuated inversion recovery, spin echo T1-WI with and without contrast and three dimensional spoiled gradient echo. Details are in the supplementary material available online.
Image analysis
Image analysis was performed in the Buffalo Neuroimaging Analysis Center, Buffalo, New York, USA, using approaches previously described.19 20 The MRI analysts were blinded to the patient clinical characteristics and vitamin D status. T2 lesion volume (LV), T1-LV21 and brain parenchymal fraction (BPF)22 were calculated using methods described in the supplementary material available online.
Statistical analysis
Statistical analyses were conducted using SPSS (V.18).
Vitamin D metabolite data were evaluated for the presence of seasonal trends using sinusoid regression. Separate sinusoidal regression models were fitted for 25(OH)VD and each of four vitamin D metabolites, 25(OH)VD3, 25(OH)VD2, 1,25(OH)2VD3 and 24, 25(OH)2VD3, and the month in which the sample was collected using the method described previously.23 Data for 25(OH)VD and the three VD3 metabolites exhibited seasonal trend and were deseasonalised by adding the residual generated by the relevant sinusoidal model for each study participant to the model mean for the metabolite. Deseasonalised values for 25(OH)VD, the three VD3 metabolites and unadjusted 25(OH)VD2 data were log transformed to reduce skewness. Multiple Sclerosis Severity Scale (MSSS), T2-LV and T1-LV were normalised by cube root transformation.
Relationships between vitamin D metabolites (independent variable) and disability/MRI outcomes (dependent variable) adjusted for other predictor variables were assessed using regression analyses. Five individual models (one for 25(OH)VD and one for each of four vitamin D metabolites) were fit for each clinical (Expanded Disability Status Scale (EDSS), MSSS) and MRI outcome (T2-LV, T1-LV, BPF).
Ordinal logistic regression was used to evaluate the relationship between vitamin D metabolites and EDSS (categorised as 0–1.5, 2.0–3.5 or ≥ 4.0). The relationships between vitamin D metabolites and MSSS, T2-LV, T1-LV and BPF were assessed using linear regression. Main effect models for vitamin D metabolites as predictors of EDSS and MRI outcomes were adjusted for age at blood draw, duration of disease (from symptom onset), self-reported race (Caucasian/other vs African–American), disease course (RR vs SP) and gender. Linear regression models predicting MSSS included the same set of covariates with the exception of disease duration.
The relationship between 24, 25(OH)2VD3 and level of disability (outcome variable) was further explored by assessing the likelihood of high (EDSS ≥4.0) versus low (EDSS <4.0) disability according to quintile of deseasonalised 24,25(OH)2VD3. ORs and associated 95% CIs adjusted for age, sex, race and duration of disease were estimated using unconditional logistic regression; the highest quintile of 24, 25(OH)2VD3 served as the reference category.
Results
Study population
The study population consisted of 193 MS patients (170 RR and 23 SP MS; 152 women, 41 men, 78% women). The majority of patients (94.9%) were receiving disease modifying treatment. The demographic and clinical characteristics are summarised in table 1.
Demographic characteristics of the cohort
Assay performance
Levels of 25(OH)VD3, 25(OH)VD2 and 24, 25(OH)2VD3 are in ng/ml range whereas 1, 25(OH)2VD3 levels are significantly lower, in the low pg/ml concentration range, markedly below the lower limit of quantitation of a conventional LC/MS/MS method. Chemical derivatisation with PTAD improved the ionisation and fragmentation behaviour of the metabolites, and with selective SPE-μLC/MS/MS, an approach that has proven useful for a range of difficult pharmaceutical analytes,24 25 we achieved a lower limit of quantitation of 5.0 pg/ml, 10 pg/ml, 100 pg/ml and 100 pg/ml for 1, 25(OH)2VD3, 24, 25(OH)2VD3, 25(OH)VD2 and 25(OH)VD3, respectively; the assay required only 0.2 ml of serum. The linear range was 0.005–1.0 ng/ml for 1, 25(OH)2VD3, 0.05–10.0 ng/ml for 24, 25(OH)2VD3 and 0.1–20.0 ng/ml for both 25(OH)VD3 and 25(OH)VD2. The standard curves for all metabolites had correlation coefficient (R2) of 0.99 or greater.
The optimised assay was tested with validated with quality control samples. Intra-day precision was in the range of 2.0–10.6% and inter-day precision was in the range 1.5–12.1%. The quantitative error was <11.5%. A detailed description of the method, its validation and preliminary comparisons of analyte levels in MS patients and controls has been reported previously.14
Variations in vitamin D in MS patients
There was no difference in vitamin D metabolites according to gender. However, both unadjusted and deseasonalised 25(OH)VD (deseasonalised values: 14.9±9.7 ng/ml in African–Americans vs 25.8±9.1 ng/ml in Caucasians), 25(OH)VD3 (deseasonalised values: 11.1±5.3 ng/ml in African–Americans vs 21.7±9.3 ng/ml in Caucasians), 1, 25(OH)2VD3 (deseasonalised values: 0.020±0.011 ng/ml in African–Americans vs 0.029±0.016 ng/ml in Caucasians) and 24, 25(OH)2VD3 (deseasonalised values: 1.5±0.84 ng/ml in African–Americans vs 3.9±3.0 ng/ml in Caucasians) levels differed significantly by self-reported race, with those in the Caucasian/other category having significantly higher vitamin levels than African–Americans (all p<0.006). There was no difference in 25(OH)VD2 levels for African–Americans versus Caucasians/other (3.8±10.0 ng/ml in African–Americans vs 4.1±7.6 ng/ml in Caucasians).
Duration of treatment with DMT demonstrated a mild positive correlation with both unadjusted (r=0.16, p=0.04) and deseasonalised 25(OH)VD (r=0.19, p=0.011). Duration of disease but not age at blood draw was positively significantly correlated with both unadjusted (r=0.17, p=0.016) and deseasonalised 25(OH)VD (r=0.20, p=0.005). Duration of treatment with DMT and unadjusted 1, 25(OH)2VD3 levels were weakly correlated with age at blood draw (Spearman r=0.16, p=0.026 and r=−0.19, p=0.010, respectively). However, these correlations were not present in deseasonalised data. There was no association between total vitamin D or any vitamin D metabolites and age at onset.
Unadjusted serum concentrations of 25(OH)VD and two of the three VD3 metabolites demonstrated significant seasonal variation (sinusoid regression ANOVA F=3.73, p=0.026; 25(OH)VD3 (F=3.61, p=0.029) and 24, 25(OH)2VD3 (F=3.16, p=0.044)) (table 2). A non-significant seasonal trend was observed for 1, 25(OH)2VD3 (F=2.05, p=0.13). Unadjusted 25(OH)VD2, which is derived solely from dietary sources, did not exhibit seasonal variation (p=0.65). Mean total 25(OH)VD and the three metabolites exhibiting seasonal trends were at their lowest levels in February and reached their highest levels in July with the exception of 1, 25 (OH)2VD3 which peaked in June.
Mean unadjusted and deseasonalised concentrations of 25-hydroxyvitamin D and vitamin D metabolites (ng/ml) for all patients, and RR-MS versus SP-MS patients
Vitamin D and clinical disability
Overall 25(OH)VD, 25(OH)VD3 and 24, 25(OH)2VD3 were statistically significant predictors of disability, as measured by MSSS, even after adjusting for other covariates, with increased vitamin D levels associated with decreased disability (table 3: p values ranged from 0.017 to 0.004).
Ordinal regression results for EDSS and linear regression results for MSSS
The three vitamin D measures were also inversely associated with disability, as measured by EDSS, although the association between overall 25(OH)VD and EDSS did not reach statistical significance (p=0.054). The 24, 25(OH)2VD3 metabolite showed the strongest association with disability for both disability measures (EDSS: p=0.013; MSSS: p=0.004).
Because 24, 25(OH)2VD3 showed the strongest associations with disability, it was further examined in logistic regression. The likelihood of being more disabled increased as level of deseasonalised serum 24,25(OH)2VD3 decreased (linear trend p=0.006), with ORs for those in the two lowest quintiles of 24, 25(OH)2VD3 exceeding 3.70 (table 4).
Likelihood of EDSS ≥4.0 versus EDSS <4.0 according to level of deseasonalised serum 24,25(OH)2VD3
Vitamin D and MRI
MRI characteristics are summarised in table 1. Neither total vitamin D nor any of the four vitamin D metabolites were significantly associated with T2-LV, T1-LV or BPF (All p≥0.20). Likewise, the ratio of 25(OH)VD3:24,25(OH)2VD3 did not show a significant association with T2-LV or T1-LV. However, the ratio of 25(OH)VD3 to 24, 25(OH)2VD3 was inversely significantly associated with BPF with a partial r=−0.201 (p=0.004, β=−0.009, SE=0.0035; Wald χ2=6.95, p=0.008).
Discussion
We have investigated the relationships of vitamin D and its metabolites to disability and to MRI measures of lesional injury and brain atrophy. Deseasonalised 24, 25(OH)2 VD3 levels were consistently associated with both disability measures. The 25(OH)VD3 to 24, 25(OH)2VD3 ratio was associated with BPF.
Our μLC/MS/MS assay was important for enabling the systems pharmacology approach, which to our knowledge has not been used to investigate vitamin D metabolism in MS disease progression. The low serum concentration of 1, 25(OH)2VD3, low ionisation efficiency and fragmentation patterns of vitamin D metabolites precluded sensitive detection by selected reactions monitoring.26 27 To obtain higher sensitivity, samples were derivatised with PTAD, which is specific for vitamin D metabolites, and the SPE step enabled loading of analytes extracted from a relatively high volume of sample into the μLC separation step.28 The method achieved sensitive and selective quantification of vitamin D metabolites in 0.2 ml of serum.
In the vitamin D metabolic pathway, 25(OH)VD3 undergoes hydroxylation to 1, 25(OH)2VD3 and 24, 25(OH)2VD3 via parallel reactions. Although 1, 25(OH)2VD3 is the critical bioactive form, formation of 24, 25(OH)2VD3 is important for regulating the toxic effects of excessive 1, 25(OH)2VD3. The actions of 1, 25(OH)2VD3 on target cells enhance its own degradation by inducing CYP24A1.29 There is now evidence that 24, 25(OH)2VD3 is biologically active on its own and binds a specific receptor—its activity is important in bone integrity and healing.30 31 Interestingly, 24, 25(OH)2VD3 is a better substrate than 25(OH)VD3 for the CYP27B1 enzyme involved in the 1α hydroxylation reaction that produces 1, 25(OH)2VD3.32 Because 24, 25(OH)2VD3 binds to and increases the activity of catalase, the enzyme responsible for eliminating hydrogen peroxide, its effects could be mediated by modulation of oxidative injury.33 Given the complex cross regulation and multiple active species in the vitamin D system, a systems pharmacology approach that considers key metabolites is important.34
Unadjusted levels of 1, 25(OH)2VD3, the active vitamin D metabolite, were positively correlated with unadjusted levels of 25(OH)VD3 (Spearman r=0.57, p<0.001) and 24, 25(OH)2VD3 (Spearman r=0.61, p<0.001) but negatively correlated with 25(OH)VD2 (Spearman r=−0.25, p<0.001). The structure of VD2 differs from VD3 in the methyl group at C24 and C22-23 double bond. Because VD3 and VD2 share CYP450 enzymes and undergo similar hydroxylations, competition in the metabolic pathway (or vitamin D binding protein) may explain the negative associations.
In addition to individual metabolites, we also investigated the ratios of the vitamin D metabolites. Metabolic ratios are widely used in systems pharmacology because they provide robust measures of the relative importance of alternative pathways, an important issue in the vitamin D system. Only the 25(OH)VD3 to 24, 25(OH)2VD3 ratio was associated with disability and MRI measures. The 25(OH)VD3 to 24, 25(OH)2VD3 ratio is a measure of the proportion of the 25(OH)VD3 that is converted to 24, 25(OH)2VD3 and can be viewed as a measure of turnover. In the most direct interpretation, the results are consistent with the possibility that the biological activities of 24, 25(OH)2VD3 have a protective role in MS disease progression. However, the results also implicate the interdependent metabolic processes involving 25(OH)VD3, 1, 25(OH)2VD3 and 24, 25(OH)2VD3 as a potential contributing factor in MS progression.
Our results are consistent with an Australian study that found increased disability was associated with low levels of vitamin D.6 In paediatric MS, increased 25(OH)VD3 levels were found to be associated with decreased relapse rates.35 Further studies are needed to establish whether low 24, 25(OH)2VD3 causatively leads to increased disability.
However, given that this is a cross sectional study, there is the possibility that higher levels of disability resulted in alterations in the vitamin D production due to lower levels of outdoor activity and consequently less exposure to sunlight. More disabled patients may also be less able to obtain nutritionally diverse foods and could be more susceptible to problems with organ function that could affect the vitamin D pathway. These considerations limit the ability to obtain cause–effect assessments from these associations and our findings could thus potentially also be the result of lifestyle changes consequent to disability.
Elegant twin studies from the Canadian Collaborative Study Group have demonstrated that vitamin D levels in MS concordant twins are highly correlated but no difference between MS discordant twins by affection status was found.36 These studies have also demonstrated that the environmental risk in MS susceptibility acts at the population level and the contribution of shared environment is not significant.37 Genetic variations also have an important role in vitamin D levels. Examples include variations genes such as the vitamin D receptor,38 CYP27B1 involved in the synthesis of 1, 25(OH)2VD3, CYP24A1 involved in deactivating 1, 25(OH)2VD3 and vitamin D binding protein, which has been shown to regulate absorption.39 Vitamin D can also alter expression of HLA DRB1*150140 and regulate a host of immunomodulatory genes.41 We have not explored the role of genetic factors in this study.
Our results did not provide evidence for beneficial associations of 25(OH)VD2 with disability and MRI measures. However, no specific recommendations for selecting between VD3 versus VD2 supplementation are available for treating vitamin D deficient MS patients. The majority of high dose vitamin D products (ie, those with 50 000–150 000 U) contain ergocaliferol (VD2). The parenteral products rapidly normalise vitamin D levels and overcome patient adherence problems.42 Notably, VD3 but not VD2 is effective at reducing fracture risk.43 VD3 versus VD2 supplementation in MS should be compared based on longer term outcomes in clinical trials.
Sunlight exposure and skin colour are factors that could potentially affect vitamin D levels. Sunlight exposure has been assessed with surrogates such as latitude of residence, self-reported questionnaires or by measuring actinic damage using silicone casts. We deseasonalised the VD3 metabolites to address the role of this covariate.
We did not have data available on sun exposure, supplementation and diet at the time of blood sampling. Our approach could be potentially criticised because it does not use these ‘external’ measures and focuses instead on obtaining analytical measurements of vitamin D metabolites. However, VD2 metabolites can be obtained only from diet and supplementation. Consistent with this we found a highly skewed distribution of 25(OH)VD2 levels in our samples (median 0.7 ng/ml but with an interquartile range of 4.2 ng/ml). This suggests that VD2 supplementation can be assessed from serum 25(OH)VD2 levels after thresholds are developed from controlled supplementation studies. Furthermore, serum levels of vitamin D metabolites may potentially provide an assessment of vitamin D status that integrates the effects of genetic and environmental factors (eg, sunlight exposure, diet and supplementation) and variability in absorption, disposition, metabolism and elimination.
In conclusion, our results indicate that vitamin D metabolism is associated with disability and lower BPF in MS. Prospective clinical studies are necessary to assess vitamin D supplementation and the mechanisms contributing to MS progression.
References
Supplementary materials
Web Only Data
Files in this Data Supplement:
Footnotes
See editorial commentary, p 121
Linked article 231308.
Funding Support from the National Multiple Sclerosis Society (RG3743 and a Pediatric MS Center of Excellence Center Grant) and the Department of Defense Multiple Sclerosis Program (MS090122) is gratefully acknowledged.
Competing interests BW-G received personal compensations for consulting, speaking and serving on a scientific advisory board for Biogen Idec, Teva Neuroscience and EMD Serono. She also received financial support for research activities from the National Multiple Sclerosis Society, National Institutes of Health, ITN, Teva Neuroscience, Biogen Idec, EMD Serono and Aspreva. RZ received personal compensation from Teva Neuroscience, Biogen Idec, EMD Serono and Questcor Pharmaceuticals for speaking and consultant fees. RZ received financial support for research activities from Biogen Idec, Teva Neuroscience, Genzyme, Bracco, Questcor Pharmaceuticals, EMD Serono, Direct MS Foundation, Jacquemine Foundation and Bracco. MR served as an editor for the American Association of Pharmaceutical Scientists Journal; receives royalties for publishing The Pharmacy Calculations Workbook (Pinnacle, Summit and Zenith, 2008); and receives research support from EMD Serono, Novartis, Pfizer, the National Multiple Sclerosis Society, the Department of Defense and the National Science Foundation. He has served as a consultant for Biogen Idec, Allergan and Netezza.
Ethics approval This study was conducted with the approval of the University at Buffalo.
Provenance and peer review Not commissioned; externally peer reviewed.
Linked Articles
- Editorial commentary