Article Text

Abstract
Objective Cortical grey matter lesions are common in multiple sclerosis (MS), but usually not seen on MRI. The authors compared the performance of double inversion recovery (DIR, currently considered the best available imaging sequence for detecting cortical lesions) with phase-sensitive inversion recovery (PSIR, a sequence allowing much higher resolution scans to be obtained in a clinically feasible time).
Methods Sixty MS patients and 30 healthy controls underwent MRI scanning on a 3 Tesla scanner. The authors compared intracortical (IC) and leucocortical (LC) lesion counts obtained with a standard DIR sequence (1×1×3 mm resolution, obtained in 4 min) and a PSIR sequence (0.5×0.5×2 mm, 11 min). Lesions were marked separately on DIR and PSIR scans.
Results In the whole MS cohort, more cortical lesions were seen on the higher-resolution PSIR than the DIR scans (IC mean±SD: 18.1±9.8 vs 5.9±4.5, p<0.001; LC mean±SD: 13.4±12.9 vs 7.3±8.0, p<0.001). On PSIR, ≥1 IC lesion was seen in 60/60 MS patients and 1/30 controls, and ≥1 LC lesion in 60/60 patients and 6/30 controls. On DIR, ≥1 IC lesion was seen in 50/60 patients and 0/30 controls, and ≥1 LC lesion(s) in 60/60 patients and 5/30 controls.
Conclusions Compared with DIR, using PSIR the authors are able to detect a significantly greater number of cortical grey matter lesions. The presence of at least one IC lesion in every MS patient, but very few healthy controls, suggests that it may be a useful adjunct to conventional MRI when a diagnosis of MS is suspected but not confirmed.
- Multiple sclerosis
- MRI
- cortical lesions
- grey matter
- neuropathology
- neuroradiology
Statistics from Altmetric.com
Introduction
Cortical grey matter lesions are a common finding in neuropathological studies of multiple sclerosis (MS),1–4 and in some studies are more extensive than lesions seen in white matter. However, conventional MRI using T2-weighted, or fluid-attenuated inversion recovery (FLAIR) sequences, reveals few cortical lesions, and is considerably less sensitive to cortical than white matter lesions.2 ,5 ,6 A sensitive method to detect cortical lesions in vivo might assist the diagnosis of MS and provide a new way to monitor the course of MS and its modification by treatment.
Double inversion recovery (DIR), a sequence designed to suppress signals from white matter and cerebrospinal fluid, detects more cortical lesions than FLAIR sequences.2 ,5 ,7 ,8 Several studies have demonstrated associations of cortical lesions load on DIR with physical and cognitive impairment,1 ,2 ,9–14 suggesting that they are clinically relevant. However, DIR imaging prospectively detects only 18% of pathologically confirmed cortical lesions.5 ,15 Furthermore, DIR sequences are limited by low signal-to-noise ratio (SNR), and image intensity, non-uniformity and blood flow artifacts may be misinterpreted as lesions.
DIR scans can be read in combination with another image to improve accuracy and sensitivity.9 Phase-sensitive inversion recovery (PSIR) is a T1-weighted sequence with phase-sensitive reconstruction that provides a greater range of signal intensity than conventional T1-weighted inversion recovery sequences by additively combining negative and positive longitudinal magnetisation in the image.10 It provides better grey matter–white matter contrast than other T1-weighted sequences,16 and when acquired at the same resolution as DIR, was useful in confirming the presence of MS cortical lesion and avoiding ‘false positives’.10
The combination of high SNR and contrast has facilitated development on a 3 Tesla scanner of a 2-dimensional (2D) PSIR sequence that, at 0.5×0.5 mm2 in-plane and 2 mm slice thickness (equal to a voxel size of 0.5 mm3), provides up to 6 times greater resolution than 2D DIR acquired with a typical resolution of 1×1 mm in-plane and 3 mm slice thickness2 ,17 (voxel size of 3 mm3), and 2–4 times more than previously reported 3D DIR sequences (with voxel sizes ranging between 1 and 2 mm3).5 ,18–20 Except at ultra-high field strengths (eg, 7 Tesla20), sub-millimetre voxel sizes cannot be obtained using DIR sequences without prohibitively long scan times, but are achievable using the PSIR sequence in clinically acceptable times (in this study, 11 min). The higher resolution on PSIR improves definition of the cortex and its surroundings, and should facilitate detection of grey matter lesion.
The main aim of our study was to compare the higher-resolution PSIR versus a standard resolution DIR sequence when used independently to detect cortical lesions in MS.2 For comparison, we chose a 2D DIR sequence that has been extensively studied in MS populations.2 Additionally, we investigated: (1) the frequency of cortical lesions in MS patients and healthy controls to explore their specificity for MS and (2) cortical lesions in MS clinical subgroups, and their associations with clinical measures.
Materials and methods
Participants
Sixty patients aged 18–65 years with clinically definite MS,21 and 30 healthy controls with no known neurological disease (3 with a first-degree relative with MS) were enrolled in the study. All participants gave written informed consent. This study had approval from our local institutional ethics committee. Thirty patients had relapsing remitting MS, and 15 each primary and secondary progressive MS.22 Disease duration and previous or current treatment with disease modifying drugs were noted. Clinical status was assessed using the Expanded Disability Status Scale,23 MS Functional composite scale and its 3 components (9-Hole Peg Test, 25 Foot Timed Walk Test and Paced Auditory Serial Addition Test),24 and the Symbol Digit Modalities Test.25 ,26
Image acquisition
Brain MRI was performed on a 3T Achieva TX system (Philips Healthcare, Best, The Netherlands) using a 32-channel coil. Dual echo T2-weighted turbo spin echo, turbo FLAIR, DIR and PSIR sequences were acquired (sequence details are given in table 1).
Acquisition parameters
Image analysis
Cortical lesions were marked independently on the DIR and PSIR scans, using the FLAIR and T2-weighted images for reference. Lesions confined to the cortex were called intracortical (IC). Lesions that involved both, cortex and juxtacortical white matter, were called leucocortical (LC).
Using JIM version 6.0 (Xinapse Systems, Northants), lesion marking was performed by two experienced observers in consensus (VS, DC), and supervised throughout by an experienced neuroradiologist (TY), blinded to subject identity. To independently assess lesion detection on each scan type, they were marked separately on DIR and PSIR sequences. Direct lesion-by-lesion comparison was not undertaken.
Cortical lesions were identified on DIR scans using published consensus recommendations.1 ,2 ,8 Lesions had to be clearly hyperintense, and cover at least 3 voxels (based on 1 mm2 in-plane resolution). Careful attention was paid to avoid artifacts commonly observed in regions such as the anterior temporal lobes, occipital lobes, insula and medial frontal lobes. Slices adjacent to suspected lesions were viewed—this helped to exclude cortical vessels from being falsely counted as lesions.
As no previous guidelines have been proposed for identifying cortical lesions independently on PSIR, we developed a set of rules under the guidance of an experienced neuroradiologist (TY; see table 2). In a previous report, ‘worm-like’ lesions with a curvilinear appearance that followed one or more cortical gyri were reported in 25% of MS subjects using DIR.2 To explore how characteristic they might be for MS, we noted the number of subjects who had at least one such curvilinear lesion on the PSIR and DIR scans (see example in figure 1).
Rules for defining cortical lesions on PSIR
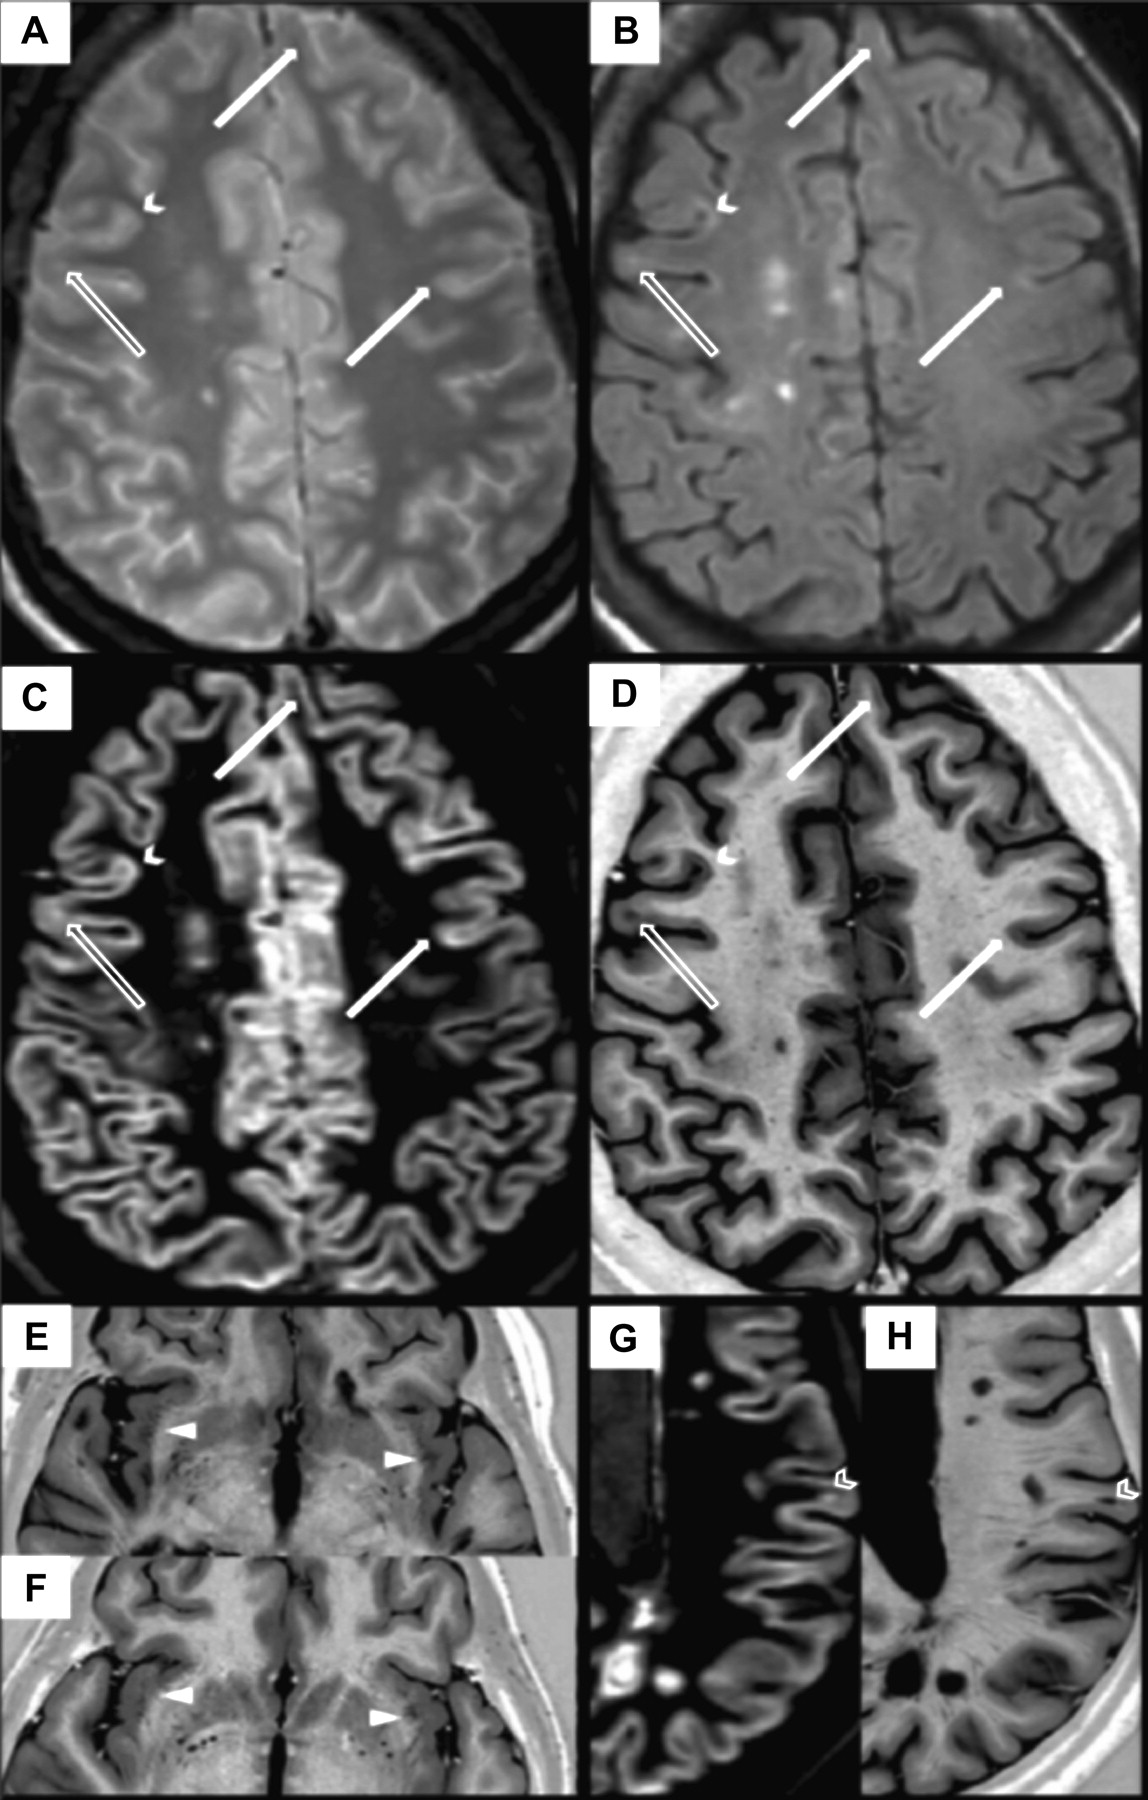
Corresponding T2-weighted (A), FLAIR (B), DIR (C) and PSIR (D) images. Examples of intracortical (solid arrow), leucocortical (open arrow) and a curvilinear lesion (solid chevron) have been marked on all scans, and are more conspicuous on PSIR than DIR, FLAIR/T2; Examples of VR spaces (solid triangle) in a patient with SPMS (E) and a healthy control (F); juxtacortical lesions (open chevron) seen on corresponding DIR (G) and PSIR (H) images. Note how lesions are more conspicuous on PSIR than DIR.
White matter lesions were counted on the PSIR and T2-weighted scans. On PSIR, they were sub-classified as juxtacortical (JC; touching but not entering cortex) or other (figure 1). A JC lesion was differentiated from an LC lesion based on preservation of the normal cortical contour and absence of hypointensity in adjacent cortex. JC lesions could not be convincingly separated from LC lesions using DIR and were, therefore, not sub-classified on this sequence.
To assess inter-rater reproducibility of marking lesions on PSIR, 10 randomly selected scans were evaluated independently by three raters (DC, NM, VS) using the guidelines described in table 2. To assess intra-rater reproducibility, the scans of these 10 patients were marked three times by one rater (VS) (supplementary table 2).
To assess the contrast-to-noise ratio between grey matter and white matter, we randomly selected 10 healthy controls, and placed a total of 12 0.78 mm2 regions of interest (ROI) on three separate slices, in regions of normal-appearing cortical grey matter (at the level of vertex, insula and temporal poles) and neighbouring normal-appearing white matter. The ROI size was chosen to be large enough to sample grey matter signal, but small enough to be fully contained in the grey matter in each subject. The ROIs were placed in the same location for each control on DIR and PSIR images. Mean absolute signal values were noted, and the relative contrast between grey matter and white matter on both sequences was calculated based on the formula described by Mainero et al.29
Statistics
Lesion distribution was tested for normality using a Kolmogorov–Smirnov test. As the distribution of lesions was not found to be normal, nonparametric tests were used for further analysis. Wilcoxon signed-rank tests were used to compare PSIR and DIR lesion counts in the MS cohort, and Spearman's rank correlation coefficients were used to determine their association with clinical and cognitive variables. Differences in lesion counts between MS clinical subgroups were investigated with a Mann–Whitney test. SPSS (version 20) was used to perform the statistical analysis, and p<0.05 was considered significant. Intra-class correlation coefficient (ICC) was calculated for both intra-rater and inter-rater PSIR lesion counts.
Results
Demographic and clinical details are provided in table 3. Relapsing remitting MS patients did not differ significantly in age from the controls, but both, the secondary and primary progressive MS patients, were significantly older. Patients with secondary progressive MS had a longer duration of illness than both, relapsing remitting and primary progressive MS (both p<0.001). Those with relapsing remitting MS had lower Expanded Disability Status Scale scores than either progressive groups (both primary and secondary progressive, p<0.001).
Participant demographics and clinical scores
Virchow-Robin spaces, which may be mistaken for cortical lesions, were noted on PSIR, particularly in the temporal cortex and insula. Care was taken not to include these in cortical lesion counts.
The higher-resolution PSIR identified about three times more IC lesions than the lower-resolution DIR in the whole MS cohort (p<0.001; table 4). PSIR also identified more LC lesions than DIR (p<0.001); this increase was also approximately threefold when JC and LC lesions from PSIR were counted together, recalling that we could not separate JC and LC lesions using DIR. PSIR IC lesion count correlated with DIR IC counts (rs=0.604, p<0.001), and PSIR LC with DIR LC (rs=0.651, p<0.001).
Lesion counts in MS subtypes
On PSIR, ≥1 IC lesion(s) were seen in 60/60 MS patients and 1/30 controls, and ≥1 LC lesion(s) in 60/60 patients and 6/30 controls. On DIR, ≥1 IC lesion(s) were seen in 50/60 patients and 0/30 controls, and ≥1 LC lesion(s) in 60/60 patients and 5/30 controls.
Curvilinear cortical lesions that followed the contour of gyral and sulcal folds were seen in 36% patients using DIR, and 85% patients using PSIR (figure 1). Such lesions were not seen in the healthy control group.
On PSIR, relapsing remitting and secondary progressive MS patients had similar IC lesion counts, but primary progressive MS patients had significantly lower counts in comparison with both, relapsing remitting (p=0.023) and secondary progressive (p=0.029) patients. Secondary progressive MS patients also had significantly higher LC lesion counts than primary progressive (p=0.023) and relapsing remitting (p=0.008) patients (table 4).
On DIR, relapsing remitting and secondary progressive MS patients had similar IC lesion counts; primary progressive MS patients had significantly lower IC lesion counts than relapsing remitting patients (p=0.015). Secondary progressive MS patients also had significantly higher LC lesion counts than relapsing remitting (p=0.003) patients.
All MS patients had white matter lesions on their T2 and PSIR scans, with a similar overall mean lesion count (table 4), and there was a close correlation between the two measures (rs=0.965, p<0.001). T2 lesion count also correlated with DIR LC (rs=0.558, p<0.001) and PSIR IC and LC (rs=0.331, p<0.05 and rs=0.0647, p<0.001) lesion counts. There was no correlation of cortical lesion counts with disease duration.
Correlations between clinical measures and cortical lesions counts (supplementary table 1) were limited to the relapse-onset (ie, combined relapsing remitting and secondary progressive) MS cohort. When considering the relapse onset group as a whole, the most consistent correlations were between the DIR IC lesion counts and 9-Hole Peg Test (rs=0.436, p=0.003) and PSIR LC counts with the Symbol Digit Modality Test (rs=−0.440, p=0.003). None of the six controls with cortical lesion(s) on PSIR had cognitive abnormalities.
The ICC for inter-rater variability for total cortical lesion counts (IC and LC) was 0.955 (p<0.001), and for intra-rater variability it was 0.995 (p<0.001). For IC and LC lesions separately, the ICC for inter-rater variability was 0.681 (p<0.05) for IC and 0.955 (p<0.001) for LC counts, respectively. Intra-rater ICC was 0.990 and 0.984 for IC and LC lesions (both p<0.001).
There was a significantly higher grey matter–white matter contrast (Cgm-wm) on PSIR than DIR images (mean=1.48, SD=0.71 versus mean=0.05, SD=0.03; p<0.05 paired sample t-test).
Discussion
We found significantly more cortical lesions using the higher-resolution PSIR than the lower-resolution DIR scans, the scans being acquired in clinically feasible times. We also found that IC lesions were very uncommon in healthy controls but seen in all patients with MS. Limited associations of cortical lesion count with clinical measures were observed.
The proportion of MS patients with IC lesions on DIR (83%) was similar to that reported in other large MS cohorts,2 ,8 suggesting that our cohort and DIR sequence are comparable. However, compared with DIR, we identified considerably more IC lesions using PSIR. This is, at least in part, attributable to the higher resolution of the PSIR sequence; a previous study using identical resolution for PSIR and DIR did not report greater lesion detection, but noted that PSIR helped to exclude ‘false positive’ cortical lesions seen on DIR.10 Our higher-resolution PSIR sequence was obtained in only 11 min, which is clinically feasible, and better depicts cortical anatomy than DIR (figure 1, supplementary figure 1).
The detection of IC lesions in all MS patients suggests that the PSIR sequence will be more sensitive than DIR when seeking evidence for cortical lesions, for example, in cases of suspected MS. Curvilinear lesions were especially evident on the PSIR sequence, being seen in in 85% of MS subjects versus 36% on DIR. Their appearance corresponds with ‘worm-shape’ lesions previously seen on DIR in about 25% of people with MS.2
Eleven of the patients with relapsing remitting MS included in this study had a disease duration of 5 years or less, and all had IC lesion(s) visible on PSIR. A recent study of biopsy specimens obtained from people subsequently thought to have MS found a high frequency of demyelinating cortical lesions,30 suggesting that they are a common feature in early MS. Another study of patients with clinically isolated syndromes identified IC lesions on DIR in one-third of subjects, and their inclusion in imaging diagnostic criteria improved specificity MS.31 A study of patients with clinically isolated syndromes using a higher-resolution PSIR sequence would be of interest.
The frequency of IC lesion counts in relapsing remitting and secondary progressive MS was similar and may indicate that, like T2-visible white matter lesions, development of IC lesions is more common during the relapsing remitting phase. The higher frequency of LC lesions in secondary progressive MS could be due to IC lesions evolving to become LC lesions over time. However, longitudinal studies are needed to understand the evolution of cortical lesions in MS. A significant correlation was also noted between cortical lesion counts on PSIR and T2 white matter lesion counts, which might reflect common aspects of cortical and white matter lesion pathogenesis. However, cortical lesions in early MS are also associated with meningeal inflammation2 ,4 ,30 ,32 and rarely display gadolinium enhancement, suggesting partly different pathogenic mechanisms. Serial studies would clarify whether a combined count of gadolinium-enhancing white matter lesions and PSIR-detected new cortical lesions is a useful outcome measure in proof-of-concept clinical trials in relapsing remitting MS.5 ,6 ,33
We did not see exclusively subpial IC lesions, although some involved the subpial and deeper cortex (supplementary figure 1). Subpial lesions are often observed in pathological studies, especially in progressive MS,5 ,9 ,32 ,34 ,35 and very high resolution imaging on 7T and 9.4T MRI has detected them.1 ,2 ,10 ,11 ,13 ,14 ,29 ,36 Limited detection of subpial lesions may not matter should cortical lesion detection per se prove useful for diagnosis, but may be relevant when monitoring evolving pathology, especially in progressive MS.
The virtual absence of IC lesions in the healthy controls concurs with previous work using DIR at 1.5 Tesla2 ,5 ,10 ,14 ,16 ,37 However, LC lesions were seen in ∼20% of the controls, indicating that—like incidental white matter lesions—they are not uncommon in healthy individuals. IC lesions thus appear more specific for MS. The higher resolution of the PSIR sequence also helped distinguish IC from LC and LC from JC lesions; these distinctions have been previously noted to be difficult using DIR.2 ,5 ,10 ,19 ,20 To determine the specificity of PSIR-detected IC lesions (and their potential diagnostic utility), further studies should be undertaken in patients with other central nervous system diseases that may be difficult to distinguish from MS.
In relapse onset MS (ie, relapsing remitting and secondary progressive MS combined), there were limited correlations of cortical lesion number with functional measures, PSIR lesion counts being associated with a test of cognitive dysfunction and DIR lesion counts with a test of motor dysfunction. A better understanding of these findings may emerge when regional lesion counts are compared for the PSIR and DIR sequences, or when lesion volume, rather than counts, are considered.8 ,17 ,37 ,38
In patients with primary progressive MS, cortical lesion counts were smaller than in those with relapse onset MS. This mirrors what is often reported for T2 white matter lesion counts. Study of a larger cohort, and evaluation of regional lesion counts, may better clarify the effects of cortical lesions in primary progressive MS.
The PSIR sequence also depicted white matter lesions well (table 4). Whereas some MS imaging protocols might add both, DIR and FLAIR to a standard T2-weighted scan to improve detection of cortical and white matter lesions, respectively, a PSIR sequence alone might be a useful alternative add-on sequence where time is limited.
Distinction of MS cortical lesions from non-pathological areas of altered signal intensity can be difficult with either DIR or PSIR. We used consensus guidelines for defining lesions on DIR,1 ,5 ,10 ,19 and for the PSIR sequence, we developed rules based on expert neuroradiological review of the images. Characteristic features of Virchow-Robin spaces27 ,28 were identified on PSIR, especially their frequent occurrence in temporal cortex and insula. Review of FLAIR and T2 scans in conjunction with the PSIR scan was also helpful: although prospective review of these scans in isolation would rarely detect a cortical lesion, the retrospective evidence of a subtle signal hyperintensity on them at the location of a PSIR-suspected lesion provided confirmation. We found generally good inter- rater and intra-rater consensus for the identification of cortical lesions, although inter-rater classification of IC lesions was less consistent. Future studies are needed to determine to what extent PSIR-detected cortical abnormalities correspond with histopathological lesions.
Although our 2D DIR sequence had resolutions similar to those in previously published studies in MS,2 ,5 ,19–21 ,37 the voxel size is 6 times larger than that of the PSIR sequence. To increase resolution of the 2D DIR sequence to match that of the PSIR images, scan time would have to increase prohibitively as signal-to-noise is proportional to the square root of the number of scan averages. An alternative approach for DIR imaging is to use a 3D sequence. These have achieved resolutions of 1.6–1.9 mm3 at 1.5 Tesla,5 ,19–21 and 0.8 mm3 at 7 Tesla.2 ,21 However, these resolutions are ∼2–4 times lower than that of our PSIR sequence (0.5 mm3 at 3 Tesla). There may be scope in future studies to develop more efficient 3D DIR sequences for detecting cortical lesions.22 ,39
Conclusion
PSIR sequences allow us to obtain higher-resolution scans more rapidly than can be achieved using DIR. Using a higher-resolution PSIR sequence obtained in a clinically feasible time on a 3 Tesla MR scanner we detected significantly more cortical grey matter MS lesions when compared with DIR.
References
Footnotes
Disclosure: The NMR Research Unit is supported by the MS Society of Great Britain and Northern Ireland and the UCL UCLH Comprehensive Biomedical Research Centre. Sethi V receives research support from Biogen Idec and Novartis. Yousry TA serves as Editor for European Radiology Journal and has received honoraria (Board Membership) from UCB, Bristol-Myers Squibb, Biogen Idec, and grants (PI or Co-PI Coordinator) from NIHR CBRC, MRC, MS Society, PSP, Stroke, BHF, Wellcome Trust, GSK, Biogen Idec, Novartis; Muhlert N reports no disclosures. Ron M reports no disclosures. Golay X has acted as a consultant for Philips Healthcare regarding the implementation of our ASL sequence in their product. Wheeler-Kingshott CA is on the advisory board for BG12 (Biogen). Miller DH DHM has received honoraria from Biogen Idec, Novartis, GlaxoSmithKline, and Bayer Schering, and research grant support for doing MRI analysis in multiple sclerosis trials sponsored by GlaxoSmithKline, Biogen Idec and Novartis. Chard DT, receives research support from the Multiple Sclerosis Society of Great Britain and Northern Ireland and holds stock in GlaxoSmithKline.
Statistical analysis completed by: Sethi V, NMR Research Unit, Department of Neuro-inflammation, UCL Institute of Neurology.
Funding The NMR Research Unit is supported by the MS Society of Great Britain and Northern Ireland and the UCL UCLH Comprehensive Biomedical Research Centre. The MS Society of Great Britain and Northern Ireland has provided financial support for staff and research costs. (Grant number 917-09).
Competing interests None.
Patient consent Informed consent form approved by local ethics committee (London Queen Square R.E.C) was used for this project and signed by every participant.
Ethics approval London Queen Square REC.
Provenance and peer review Not commissioned; externally peer reviewed.