Article Text

Abstract
Background Major depression is common in stroke patients and associated with increased rates of disability and mortality. Identifying depression may improve mental and physical health. The aim of this review was to determine the most accurate tool for detecting poststroke depression.
Methods Seven databases were searched up to November 2012. Two authors selected studies using International Classification of Disease or Diagnostic and Statistical Manual diagnosis of depression as the reference standard. Two authors extracted data and assessed methodological quality. Included studies were synthesised using meta-analyses.
Results A total of 24 included studies provided data on 2907 participants. The Center of Epidemiological Studies-Depression Scale (CESD) (sensitivity: 0.75; 95% CI 0.60 to 0.85; specificity: 0.88; 95% CI 0.71 to 0.95), the Hamilton Depression Rating Scale (HDRS) (sensitivity: 0.84; 95% CI 0.75 to 0.90; specificity:0.83; 95% CI 0.72 to 0.90) and the Patient Health Questionnaire (PHQ)-9 (sensitivity: 0.86; 95% CI 0.70 to 0.94; specificity: 0.79; 95% CI 0.60 to 0.90) appeared to be the optimal measures for screening measures. However, the clinical utility of all tools was modest for case-finding.
Interpretation There are a number of possible instruments that may help in screening for poststroke depression but none are satisfactory for case-finding. Preliminary data suggests the CESD, HDRS or the PHQ-9 as the most promising options. Although it should be noted such scales should not be used in isolation but followed up with a more detailed clinical assessment. While there is promising data for the PHQ-2 in other populations, it performed less well than other measures.
- Stroke
- Psychiatry
- Depression
- Scales
Statistics from Altmetric.com
Introduction
Stroke is common with an annual prevalence of 700 000 in the USA.1 Improvements in medical treatment have increased the number of people surviving stroke and living with the consequences.2 A recent survey of 28 090 participants over 50 years old in Germany found a community prevalence of 7.2%.3 Mental health complications are common in acute and post-acute stages of stroke. Depression is more common in people with chronic physical illness.4–6 A systematic review of 51 studies found the prevalence of any depression (ie, major and/or minor depression) was 33% in people who have had a stroke.7 Depression is often persistent after stroke, with high risk of relapse even after remission over a long period of time.8
People with depression after stroke experience greater impairment including greater reductions in activities of daily living9 ,10 and increased mortality11 ,12 compared with non-depressed stroke patients. Untreated poststroke depression may impair physical rehabilitation and recovery.13–15 Despite the increased prevalence and morbidity associated with depression after stroke there is evidence of under-recognition in this population. For example, Williams et al16 in a study of stroke patients found that 60% of people scoring over the cut-off for depression using the Geriatric Depression Scale (GDS) were not diagnosed or treated for depression.
Stroke patients often have a high burden of physical symptoms and symptoms such as fatigue, and psychomotor retardation may be caused by stroke or depression. As such the phenomenology of poststroke depression may be different from non-comorbid depression. However, most studies have found only minor differences in presentation.17–19 A wide variety of depression case identification measures have been investigated in stroke patients. Most scales were not originally developed for stroke populations or indeed physically ill patients therefore it is important to examine scales that include somatic items (eg, Beck Depression Inventory (BDI), Hamilton Depression Rating Scale (HDRS)) and others that seek to avoid such items (eg, Hospital Anxiety and Depression Scale (HADS), Montgomery Asberg Depression Rating Scale (MADRS)). Recent meta-analyses have not shown any particular advantage for depression scales that omit somatic items in cancer patients.20 Currently there are no systematic reviews assessing the psychometric properties of such tools in this population. Therefore a systematic review and meta-analysis was conducted to address the limitations in the literature and to seek to draw conclusions concerning what are the most accurate and efficient methods of identifying depression in people after a stroke.
Methods
Data sources and searches
A search for studies assessing the validity of case identification instruments for depression was made using seven electronic bibliographic databases (Cochrane Central Trial Register, Cumulative Index to Nursing and Allied Health Literature (CINAHL), Embase, Health Management Information Consortium (HMIC), Medline, PsycINFO, Web of Knowledge). Each database was searched from inception to November 2012. The search was kept as broad as possible with subject headings and text word searches of depression terms such as ‘major depressive disorder’, ‘depression’; and observational studies terms such as ‘cross-sectional study’, ‘observational’, ‘prospective’, etc. Therefore no limitations were set for stroke populations in order to maximise sensitivity for picking up relevant references.
References of included articles, tables of contents of relevant journals (including Stroke, Cerebrovascular Diseases, Journal of Affective Disorders, Acta Psychiatric Scandinavica) previous systematic reviews and meta-analyses of case identification for depression were checked for further studies. Additionally experts in the field were contacted for further information on relevant studies.
Study selection
We included validation studies of mood questionnaires including the BDI,21 ,22 Patient Health Questionnaire-9 (PHQ-9)23 with linear scoring, Patient Health Questionnaire-2 (PHQ-2)24 with linear scoring, the two stem questions25 (either ‘low mood’ or ‘loss of interest’ found in the Diagnostic and Statistical Manual-Fourth Edition (DSM-IV) and the International Classification of Disease Tenth Edition (ICD-10)), General Health Questionnaire-12 (GHQ-12) and General Health Questionnaire-28 (GHQ-28),26 Center of Epidemiological Studies-Depression Scale (CES-D),27 GDS,28 GDS-15,29 Zung Depression Self Rating Depression Scale,30 HADS-D,31 HDRS32 (17 and 21 item versions were analysed together due to lack of separate data). The HDRS is usually applied by clinicians whereas the remaining scales are usually self-report. The reference standard was diagnosis according to DSM (eg, DSM-IV33) or ICD (eg, ICD-1034) criteria. Out of all studies, 10 used Major Depressive Disorder alone and these were entered in a subanalysis. The remainder used a broader definition of depression, for example major or minor depression, major or minor depression or dysthymia. Studies that did not clearly state the comparator to be DSM or ICD diagnosis of depression, or did not provide sufficient data to be extracted in the meta-analysis were excluded.
Data extraction and critical appraisal
All published studies that met our eligibility criteria were assessed for methodological quality independently by at least two reviewers using the Quality Assessment Tool for Diagnostic Accuracy Studies-2.35 Data were extracted independently by at least two authors and 2×2 tables were constructed from which the primary outcomes were calculated, that is, sensitivity and specificity. To maximise the available data we extracted the most consistently reported and recommended cut-off points for each of the scales.
Data-analysis
Bivariate and Hierarchical Summary Receiver Operating Curve (HSROC) meta-analyses were conducted where possible using R 2.15.1 using the meta-analysis of diagnostic accuracy (MADA) and HSROC packages in order to obtain pooled estimates of sensitivity and specificity (≥0.8 were considered acceptable, ≥0.9 were considered good) and HSROC curves. We required a minimum of three studies to ensure stable estimates were computed. Review Manager 5 (Cochrane Collaboration) was also used for displaying data from the meta-analyses estimates generated above. Heterogeneity was assessed by visual examination of forest plots and prediction regions of HSROC plots. In addition, meta-regression and subgroup analyses were conducted to explore heterogeneity. The impact on accuracy for patients in acute (eg, hospital setting and within 6 months of stroke) versus post-acute (receiving outpatient or inpatient rehabilitation treatment) settings; and criteria for depression (major depressive disorder or any depression) was examined. Sensitivity, specificity, positive predictive values (PPVs) and negative predictive values (NPVs) were calculated. Real world clinical utility was also calculated using the clinical utility index (CUI) which takes into account frequency and discrimination of a test (see http://www.clinicalutility.co.uk). A positive CUI (CUI+) gives the ability of a test to confirm a diagnosis (case-finding) with minimal false positives and a negative CUI (CUI−) the ability of a test to rule-out a diagnosis, that is, to screen with minimal false negatives.36
Results
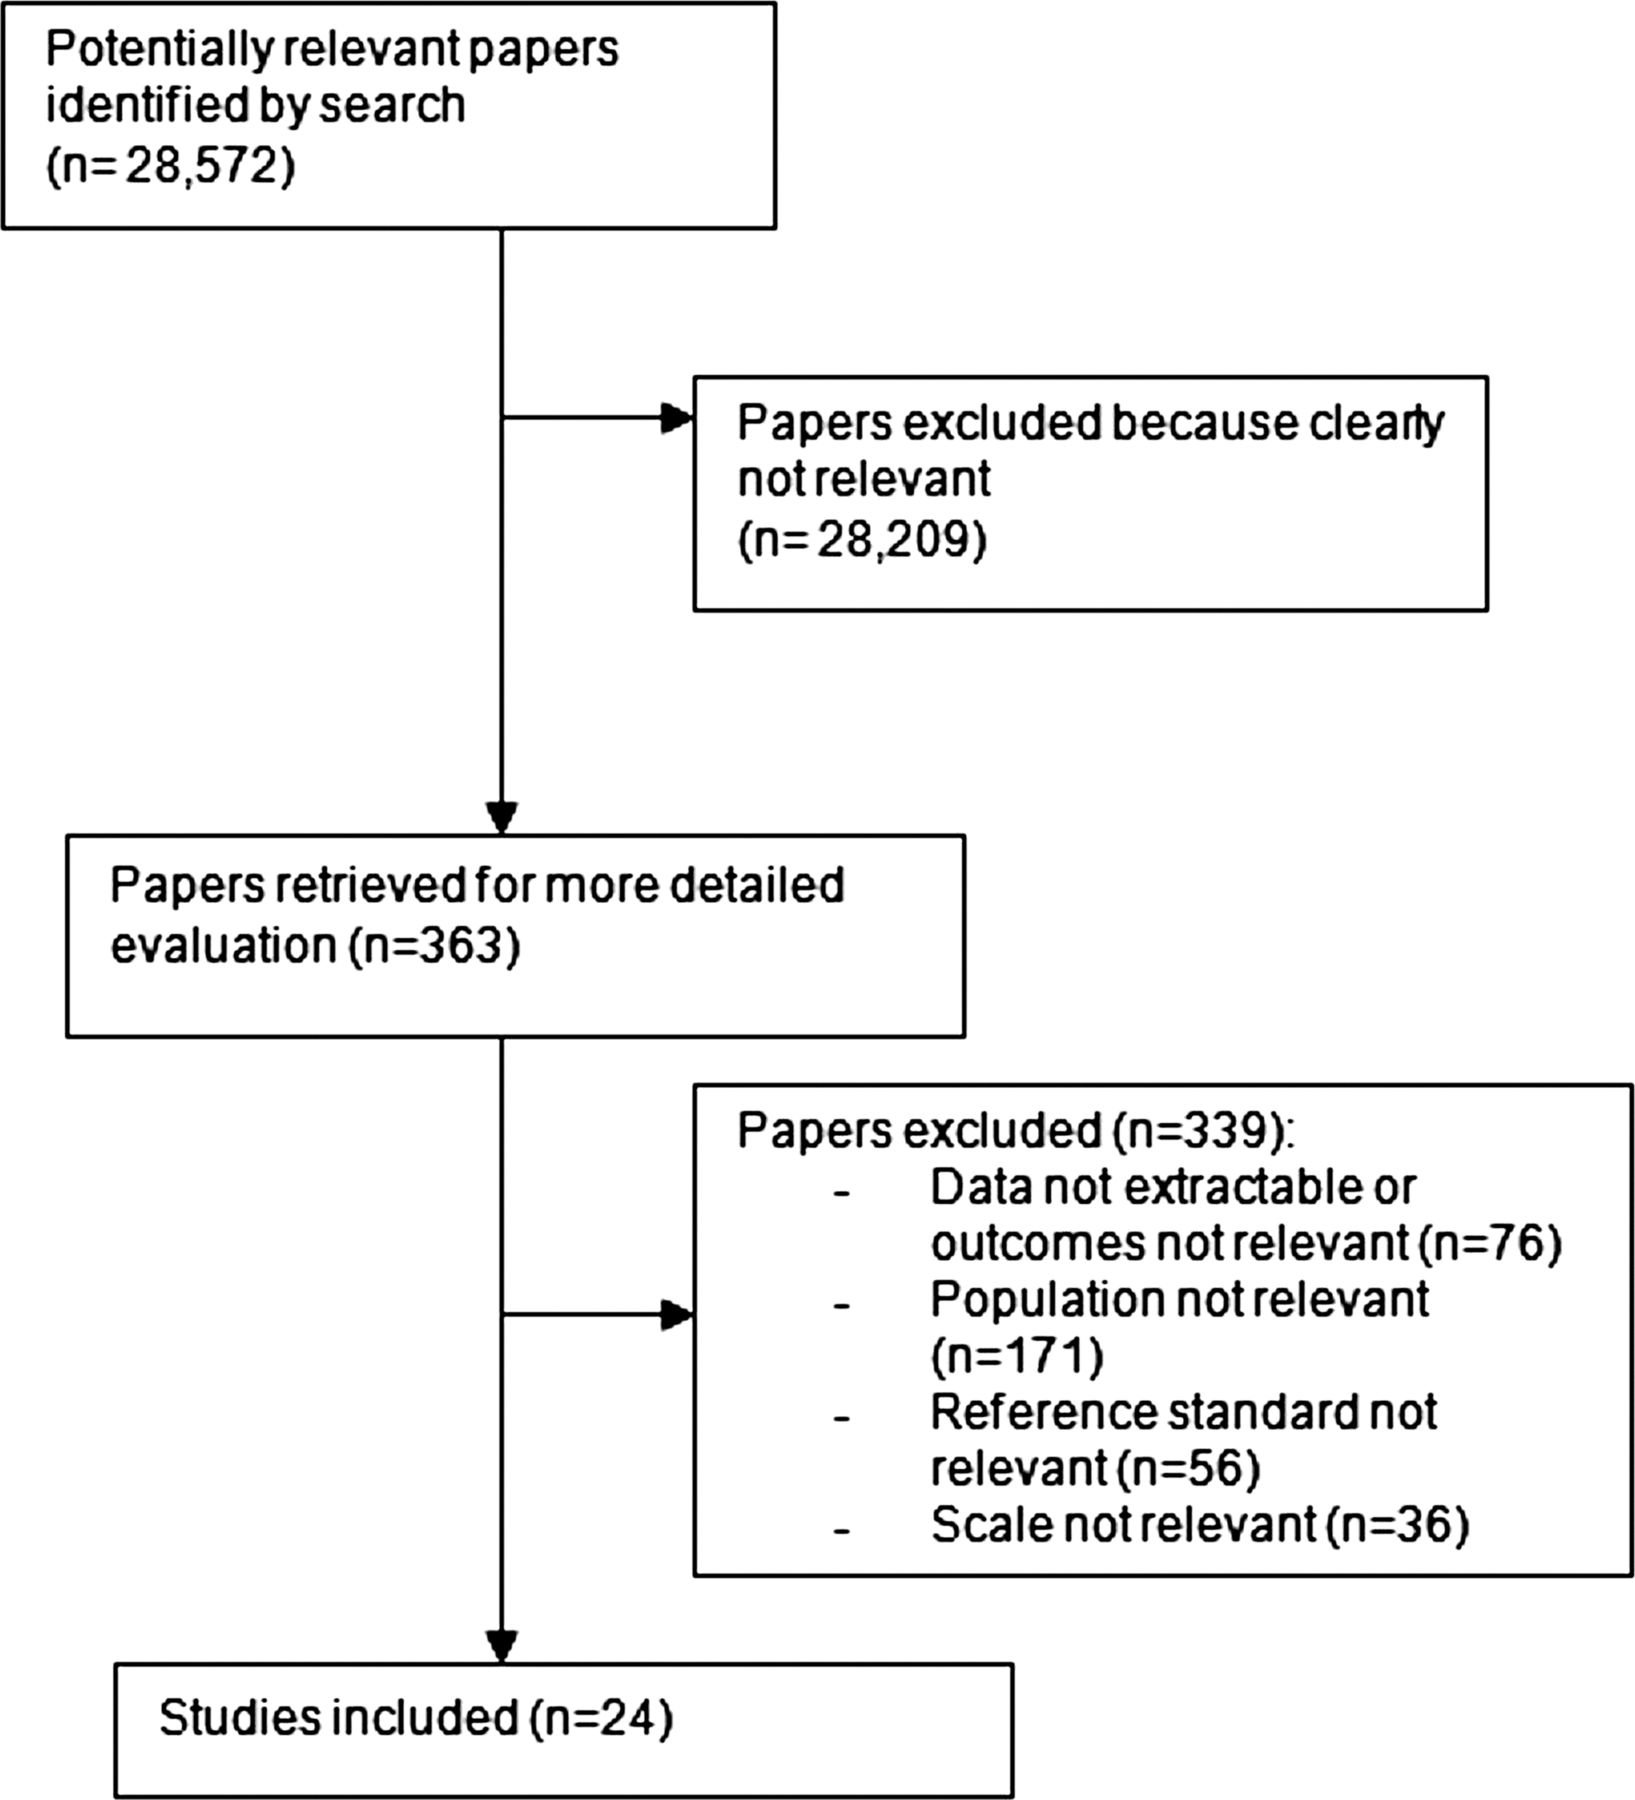
A total of 24 studies on 2,907 participants were included in the review (see figure 1).16 ,37–59 The median prevalence for any depression in these studies was 18% (range 8–46%). Mean age ranged from 55 to 80 years with some studies specifically targeting either younger or older participants which may have introduced heterogeneity into the analyses. Most studies had an approximately equal distribution of men and women. Included studies assessed a total of 18 different scales (see table 1 for study characteristics).
Summary characteristics of included studies

Study flow diagram.
Quality assessment of the included studies is summarised in online supplementary appendix 1. The most common risk of bias issues identified for these studies were not reporting blinding of assessments, not reporting predefined cut-offs for diagnostic thresholds and a lack of information concerning drop out.
Diagnostic validity meta-analyses
Any depression
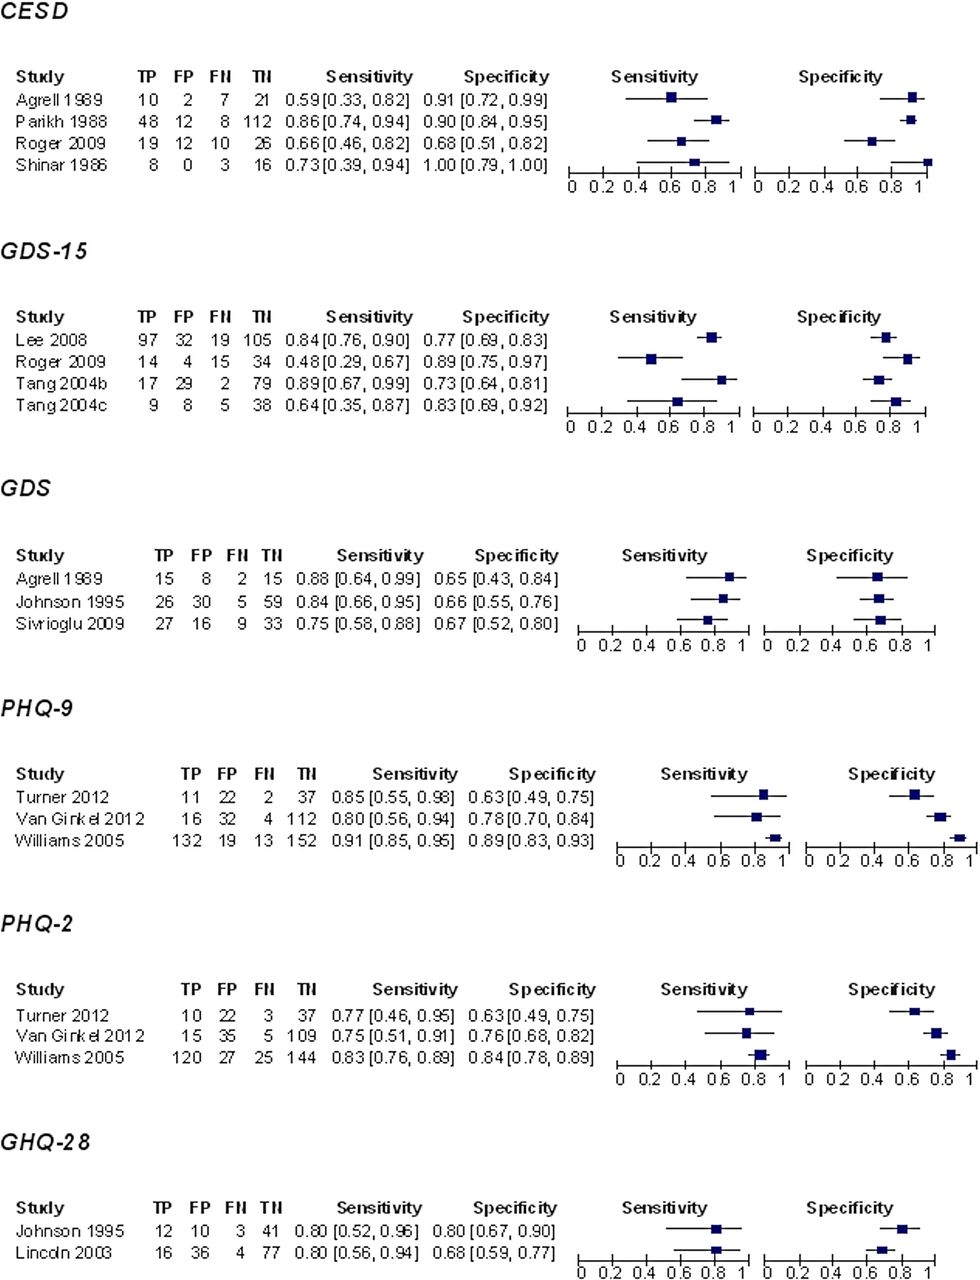
Sensitivity and specificity data for scales with at least two studies are summarised in figure 2A,B). Meta-analysis was possible for nine scales (see table 2 for summary sensitivity and specificity estimates and online supplementary appendix 2 for summary HSROC plot). Although there were three studies assessing the GDS the analysis had difficulty converging, therefore pooled estimates for this scale were not reported. It was not possible to conduct meta-analyses of direct comparisons (ie, including only data where each study compared two scales). Comparisons of the bivariate estimates suggest the scales with the highest sensitivity were the PHQ-9 and the BDI. Indirect comparisons of scales on the summary HSROC plot (see online supplementary appendix 2) suggests the three best performing scales in terms of sensitivity and specificity were the HDRS, PHQ-9 and MADRS. The HSROCs for each of these scales overlapped at most thresholds. While GDS-15 could potentially be the best measure at some thresholds it was also the poorest performing at other thresholds (requiring higher specificity). This appears to reflect the very high heterogeneity associated with this scale and uncertainty concerning its diagnostic accuracy. Substantial heterogeneity was observed for sensitivity and specificity estimates of most other scales (see figure 2A,B).
Evidence summary on meta-analysis of depression scales for any depression

(A) Forest plots for scales with a minimum of two studies. (B) Forest plots for scales with a minimum of two studies.
continued.
PPV (converted from the bivariate estimates of sensitivity and specificity) was highest for CES-D and also had the highest utility for screening (ruling out a diagnosis with minimal false negatives) in clinical practice (CUI−=0.77) followed by the HDRS (CUI−=0.76). The test with the lowest utility was likely to be BDI (CUI−=0.576). NPV was quite consistent across studies. Using the CUI, the test with the highest utility for case-finding (ruling in a diagnosis with minimal false positives) in clinical practice was likely to be either the HDRS (CUI+=0.60) or PHQ-9 (CUI+0.58) and the test with the lowest utility for case-finding was the BDI (CUI+=0.46).
Subgroup analysis of major depression
There were six scales with sufficient data to meta-analyse data for major depression (see table 3). HDRS appeared to have the best balance between sensitivity and specificity. BDI and HDRS had the highest sensitivity, and HDRS, HADS-T and PHQ-9 showed the highest specificity.
Evidence summary on meta-analysis of depression scales for major depression
PPV was highest for HDRS and also had the highest utility for screening (ruling out a diagnosis with minimal false negatives) in clinical practice (CUI−=0.86), which can be considered ‘excellent’ qualitatively. As above NPVs were very similar across studies.Using CUI, no test had adequate ability to rule in a diagnosis with minimal false positives although the optimal choice appeared to be the HDRS (CUI+=0.49) followed by the PHQ-9 (CUI+=0.35).
Subgroup analysis of acute and post-acute stroke
There were six scales with sufficient data for meta-analysis for acute stroke patients (see table 4). Sensitivity was highest for HDRS and HADS-T had the highest specificity. PPV was highest for HDRS. The test with the highest utility for screening (ruling out a diagnosis with minimal false negatives) in clinical practice was the HDRS (CUI−=0.80). Using CUI, only the HDRS had good ability to rule in a diagnosis with minimal false positives.
Evidence summary on meta-analysis of depression scales for acute and non-acute stroke
There were four scales where meta-analysis was possible in post-acute stroke patients. CES-D had the highest PPV and the highest utility for screening (CUI−=0.71) followed by the HDRS. None of the scales were rated as adequate for rule-in utility.
Meta-regression findings
Given the small number of studies for each scale there was very limited statistical power to identify potential covariates. No statistically significant effects were found on acute/post-acute stroke or type of depression assessed for any scale. It was not possible to conduct meta-regression for the HDRS or HADS-T as the models were unable to converge.
Discussion
Twenty-four studies were identified on screening for depression in stroke patients. Meta-analyses were conducted on the HDRS, HADS-D, MADRS, PHQ-9, PHQ-2, BDI, HADS-T, GDS-15 and CESD. Ideally we looked for independent verification of scale performance from multiple centres but data was often sparse, typically with three or four studies per scale included in analyses. The three scales that appeared optimal in this population were CES-D, HDRS and the PHQ-9. However, comparisons are limited by the lack of studies that directly compared one scale with another. No tool was adequately able to rule-in a diagnosis with few false positives. Conversely, the ability to exclude (rule-out) depression and confirm non-depressed status was high, with most scales making only one false negative error out of every 20 negative results. In clinical practice this means that no current scale is an adequate proxy of interview defined depression and all positive screening results should be followed by a thorough clinical assessment, diagnostic interview or repeat screen.
There have been no meta-analyses or systematic reviews of case identification instruments in stroke populations. However, the results of the present systematic review are largely consistent with others on case identification for depression in people with chronic physical health problems,20 ,62 showing inadequate case-finding ability. In high risk, high prevalence settings case-finding ability would improve as a function of discrimination (in this case PPV) and as a function of frequency in depressed patients (sensitivity). Given the interest in ultra-short screening techniques, a surprising result from our meta-analysis was that the PHQ-2 did not appear to perform as seen in other populations. The sensitivity and specificity of the PHQ-2 in stroke were 79% and 76% but we found 96%, 89% in cancer settings63 and 92% and 69%i in primary care, respectively. However in all settings where the prevalence is low rule-out performance of the PHQ2 may be adequate including patients with chronic physical health problems.
One of the limitations of this systematic review concerns the lack of studies for most included scales. It is therefore possible that the conclusions of this review may change once further research has been conducted. In particular, data on two item measures such as the PHQ-2 and the two stem questions, found by systematic reviews in relatively similar populations to have good psychometric properties, were limited. A further limitation of the review was the substantial heterogeneity identified for most scales in the meta-analysis. However, this is a problem found in most meta-analyses of case identification measures.61 Further primary studies are required before a more detailed exploration of heterogeneity is possible. A further potential limitation is that there are no available diagnostic criteria specifically for poststroke depression. Although as argued above there is limited evidence that poststroke depression differs from major depressive disorder.
Further research is needed to confirm the optimal tool for identifying depression after a stroke. Studies should focus on measures with easy interpretation and high acceptability for healthcare professionals and stroke patients. For example, although the HDRS performed well, it usually is considered a scale requiring significant time from the clinician. Similarly the BDI and GHQ-28 are probably too long for regular administration in clinical practice. Ultra-short measures such as the PHQ-2 and the two stem questions are often preferred by clinicians. New studies are beginning to investigate the use of visual-analogue scales such as the Distress Thermometer.60 It is important to note that diagnostic accuracy is no guarantee of real world benefit. Scales should be embedded into screening programmes assessing unmet needs, and desire for specialist help and then subjected to randomised controlled trials of screening versus diagnosis-as-usual.
In conclusion, there appear to be a number of potentially useful scales but none with wholly adequate rule-in and rule-out performance.
Acknowledgments
We would like to thank the following for responses to requests for further data: Dr Ann Charlotte Laska, Danderyd Hosptial, Sweden; Prof Nadina Lincoln, Univerisity of Nottingham, UK; Dr Ulrike Sagen, Telemark Hospital, Norway.
References
Supplementary materials
Supplementary Data
This web only file has been produced by the BMJ Publishing Group from an electronic file supplied by the author(s) and has not been edited for content.
Files in this Data Supplement:
- Data supplement 1 - Online appendix 1
- Data supplement 2 - Online appendix 2
Footnotes
-
Funding None.
-
Competing interests None.
-
Provenance and peer review Not commissioned; externally peer reviewed.
-
↵i Data revised for 2012 (currently unpublished).