Article Text

Abstract
Objective To investigate the role of longitudinal plasma neurofilament heavy chain protein (NfH) levels as an indicator of clinical progression and survival in amyotrophic lateral sclerosis (ALS).
Methods A cross-sectional study involving 136 clinically heterogeneous patients with ALS and 104 healthy and neurological controls was extended to include a prospective analysis of 74 of these ALS cases, with samplings at approximately 3-month intervals in a follow-up period of up to 3 years. We analysed the correlation between longitudinal NfH-phosphoform levels and disease progression. Temporal patterns of NfH changes were evaluated using multilevel linear regression.
Results Baseline plasma NfH levels were higher than controls only in patients with ALS with short disease duration to baseline sampling. Compared with controls, fast-progressing patients with ALS, particularly those with a short diagnostic latency and disease duration, had higher plasma NfH levels at an early stage and lower levels closer to end-stage disease. Lower NfH levels between visits were associated with rapid functional deterioration. We also detected antibodies against NfH, NfH aggregates and NfH cleavage products.
Conclusions Disease progression in ALS involves defined trajectories of plasma NfH levels, reflecting speed of neurological decline and survival. Intervisit plasma NfH changes are also indicative of disease progression. This study confirms that longitudinal measurements of NfH plasma levels are more informative than cross-sectional studies, where the time of sampling may represent a bias in the interpretation of the results. Autoantibodies against NfH aggregates and NfH cleavage products may explain the variable expression of plasma NfH with disease progression.
Trail registration number NIHRID6160.
- ALS
- Motor Neuron Disease
- Neuroimmunology
This is an Open Access article distributed in accordance with the Creative Commons Attribution Non Commercial (CC BY-NC 3.0) license, which permits others to distribute, remix, adapt, build upon this work non-commercially, and license their derivative works on different terms, provided the original work is properly cited and the use is non-commercial. See: http://creativecommons.org/licenses/by-nc/3.0/
Statistics from Altmetric.com
Introduction
Amyotrophic lateral sclerosis (ALS) is a relentless and mostly fatal neuromuscular disorder where the main pathological end point is the loss of motor cells.1 Typically, there is a 9–14-month delay between symptom onset and final diagnosis.2–4 This diagnostic latency is one of the strongest predictors of progression in ALS, with shorter delays linked to a worse prognosis.5 The delay in diagnosis impacts on the possible success of therapeutic trials, where it is likely that early intervention, when many motor neurons are still healthy or partially functioning, will result in the most positive outcomes.6 Indeed, the most significant benefit of riluzole, the only Food and Drug Administration (FDA)-approved treatment for ALS, is observed following early intervention.7
Central to any clinical trial design is the discovery and validation of biomarkers which reflect the clinical heterogeneity of ALS, particularly the rate of neurological decline.6 Neurofilaments (Nf) have recently emerged as ‘universal’ biomarkers of neurodegeneration.8 Assembled in unique heteropolymers, Nfs support cytoskeletal structures. They are among the main by-products of axonal loss and their phosphoforms accumulate in the perikaryon and in axonal spheroids.9 Nf levels in cerebrospinal fluid (CSF) are higher in ALS than in other neurodegenerative disorders10–14 and they correlate inversely with disease duration,15 diagnostic delay and ALS functional rating scale revised (ALSFRS_R) scores.14 Serial CSF sampling may not be practical for longitudinal disease monitoring; plasma neurofilament heavy chain protein (NfH) assays have recently shown a twofold increase of NfH in patients16 with ALS and a good correlation with CSF NfH levels.17 Studies investigating the potential of Nfs as disease biomarkers have so far involved relatively small group sizes, not representative of the ALS heterogeneity,18 and/or single measurements followed by short follow-up periods. Longitudinal studies of Nf expression at multiple time points, together with the rate of neurological decline may be a more appropriate approach to assess the bioavailability of Nfs in relationship to the natural development of the disease and eventually to treatment response.
In this study, we have up graded the sensitivity of a plasma NfH assay to obtain reliable longitudinal measurements in a large and heterogeneous ALS cohort and evaluate whether this marker could be informative of defined patterns of disease progression. We have tested plasma NfH levels over multiple time points in a follow-up period of up to 3 years in a subset of patients with ALS, using a multilevel analysis of temporal changes of this analyte in relationship to defined clinimetrics. Patients with ALS are stratified into distinct NfH temporal profiles which reflect disease progression and duration.
Methods
Participants and sampling
Approximately 20% of those patients with ALS approached declined participation in the study. In most cases, patients with ALS consented for the study shortly after diagnosis, although recruitment was not limited to newly diagnosed cases. Exclusion criteria included neurological comorbidities likely to affect Nf homeostasis, including previous neurosurgical operations, peripheral neuropathies and a recent history of neurotrauma.20–22 The control group included healthy controls (HCs) and neurological controls (NCs), affected by multiple sclerosis, a range of neuropathies, compressive radiculopathies and benign fasciculations and cramp syndrome (table 1, legend).
Plasma NfH levels and characteristics of patients with ALS and controls in the cross-sectional study
Baseline plasma samples were used for a cross-sectional study of NfH levels. Serial blood samples and clinical information were obtained on average every 2–4 months from 74 of the 136 patients with ALS, who accepted to donate further blood samples after baseline sampling. No selection criteria were applied to identify these 74 ALS individuals. Serial sampling for each patient was continued until the last clinic attendance when possible, although most of the follow-up samples were obtained within 15 months from baseline sampling, with an average follow-up period of 12.2±1 months (mean±SEM; max=39, min=1.1; 25%=4.1 months; 75%=17.9 months). For the definition of symptoms onset, clinical features suggestive of ALS, including weakness and dysarthria, were identified through interviews and further details obtained from medical records. The study clinimetrics are summarised in the online supplementary table S1 and defined in the results section.
Sample analysis
Plasma samples were processed and aliquoted within 1 h of collection and frozen at −80°C, following standard consensus procedures, including protocols for phase separation (EDTA-plasma tubes, 3500 rpm 10 min at 20°C, processed within 1 h) and storage (0.5 mL/aliquot, polypropylene tubes, screw caps, stored at −80°).23 An in-house ELISA was used to quantify hyperphosphorylated NfH (NfHSMI34) and variably phosphorylated NfH (NfHSMI35) as previously described.24 Total NfH levels represented the sum of NfHSMI34 and NfHSMI35. For western blot analyses, pooled plasma samples from three patients with ALS, purified bovine NfH (bNfH) protein (US Biological; N2160-15B) and HiMark protein standard (Invitrogen, LC5699) on 3–8% tris-acetate gels (Invitrogen, EA0375BOX) were used. Samples were pooled as the main purpose of the analysis was to demonstrate the presence of autoantibodies against Nfs. The blots were probed and imaged for NfH (SMI-34R, Covance)24; they were subsequently stripped of the NfH antibodies and reprobed with antihuman IgG (Dako, P0214) following the manufacturer's instructions (Abcam).
Statistical analysis
Numerical variables were summarised using mean±SEM, median and IQR. Non-parametric analysis was used for group comparisons (Mann–Whitney U test or Kruskal-Wallis test where suitable) and Spearman's rank correlation. Log rank analysis was used to compare survivals. The known date when a patient was last reported to be alive (if lost to follow-up) was used for censoring. Multilevel analysis was used to examine NfH longitudinal trajectory (MLwiN V.2.27, from Stata V.13.1; runmlwin command).25 Longitudinal patterns of total plasma NfH levels for the first 15 months of the follow-up period were evaluated using a multilevel model in three ALS progression subgroups: slow, intermediate and fast progressors. The model had two levels: measurement occasion (level 1), within individuals (level 2) and assumed a linear change in total NfH levels over time. Each ALS progression group was included as a categorical fixed effect and also as an interaction between the ALS progression categories and time to assess whether the rate of change in NfH differed by ALS progression rate. A random intercept term was also included in the model. Fisher's exact test was used to examine whether increased plasma NfH levels during disease progression were predictive of the decline in ALSFRS_R scores. A p value of less than 0.05 was considered as statistically significant.
Results
The demographic and clinical characteristics of our cohorts are summarised in table 1. The median diagnostic latency for the patients with ALS was 11.99 (IQR: 7.03, 20.98) months. There was a strong negative correlation between diagnostic latency and the progression rate at the last visit (PRL; (48−ALSFRS_R score at the last visit)/duration in months between symptoms onset and last visit; online supplementary table S1; Spearman's r=−0.511, p<0.0001), in line with previous observations.3
No significant difference in plasma NfH levels between HC and NC was observed (p=0.25, 0.51 and 0.20 for total NfH, NfHSMI34 and NfHSMI35 respectively; Mann–Whitney U test).
Cross-sectional and longitudinal studies of plasma NfH levels
Plasma NfH levels measured at baseline (visit 1: V1) were not significantly different between ALS (n=136) and control participants (n=104; p=0.20, 0.52 and 0.29, for total NfH, NfHSMI34 and NfHSMI35; figure 1).

A scatter plot showing plasma neurofilament heavy chain protein (NfH) levels in cross-sectional cohort. There was no significant difference in total plasma NfH (lime green), NfHSMI34 (strong blue) and NfHSMI35 (pure blue) between 136 patients with amyotrophic lateral sclerosis (ALS; squares) and 104 controls (healthy and disease controls; circles). If patients with ALS were grouped according to the disease duration from onset to baseline sampling, a trend towards an increased level of NfH-phosphoforms in patients with the shortest disease duration (0–12 months, n=31) compared with controls was noted for total NfH (p=0.059) and for NfHSMI35 (p=0.055). Error bars: median±IQR. Mann–Whitney U test.
The cross-sectional analysis was repeated comparing four subgroups of patients with ALS divided by disease duration to baseline (the time interval from symptoms onset to the baseline, online supplementary table S1). Only the subgroup with the shortest disease duration (≤12 months) showed higher levels of plasma NfH compared with controls, close to statistical significance for total NfH and NfHSMI35 (p=0.06, 0.18 and 0.06, for total NfH, NfHSMI34 and NfHSMI35, respectively; figure 1). These findings suggest that patients with a shorter disease duration and diagnostic latency were likely to progress faster and to have higher plasma NfH levels at baseline sampling.
We examined the longitudinal pattern of NfH plasma expression in 74 patients over a follow-up period of 15 months from baseline (clinical characteristics detailed in table 2).
Longitudinal ALS cohort: patient characteristics and stratification according to ALSFRS_R-based clinimetrics
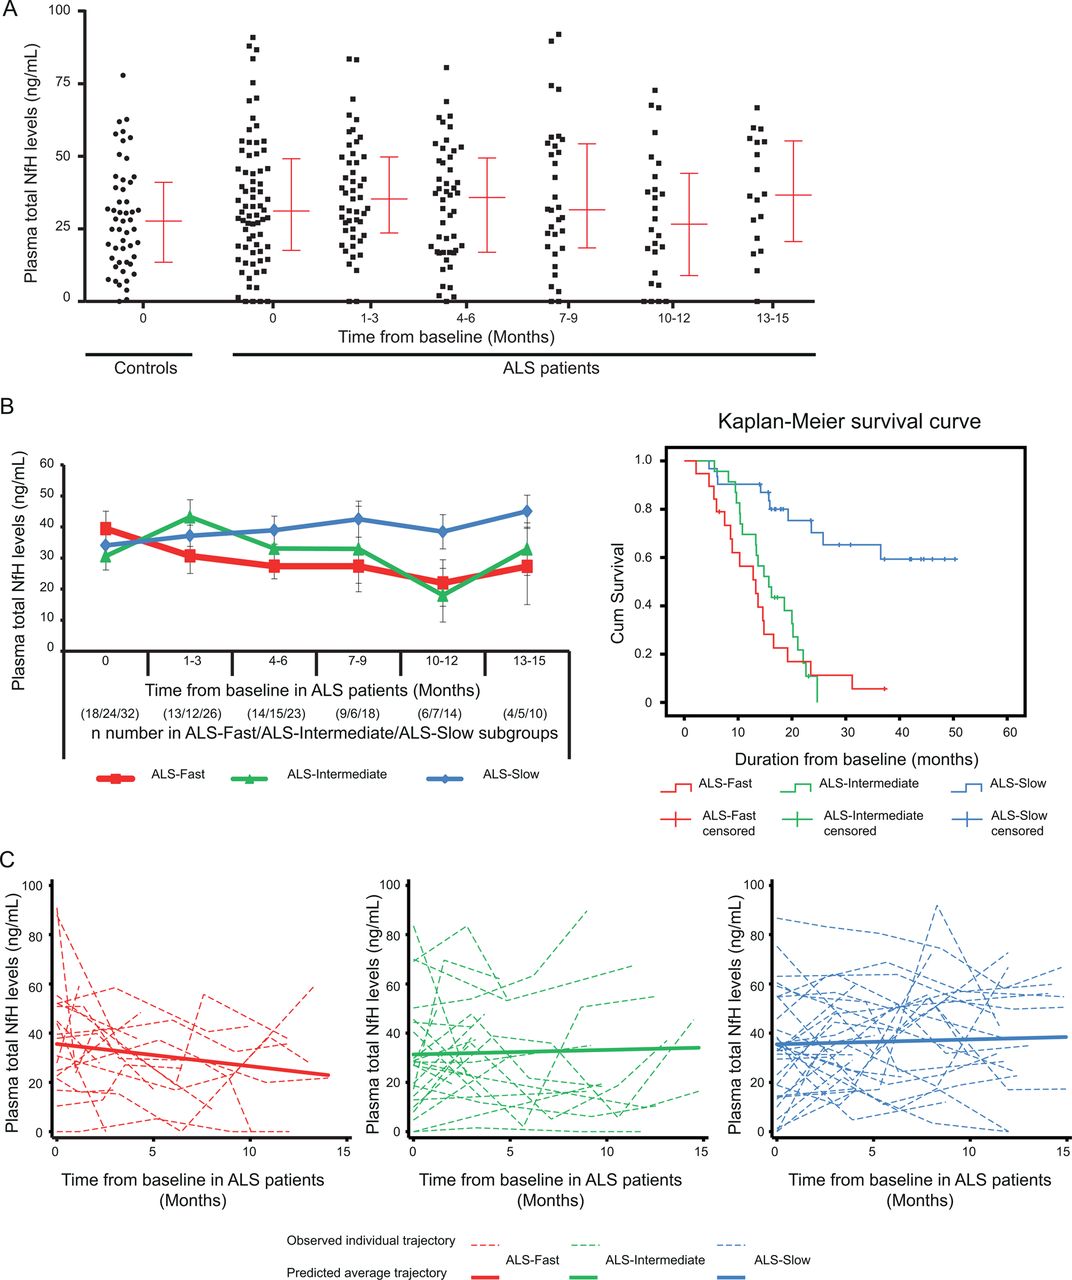
Figure 2A illustrates the plasma NfH measurements at baseline (V1) and at the subsequent time points for the 74 patients with ALS studied longitudinally, as well as at baseline for HC. We also examined longitudinal total plasma NfH levels in patients subgrouped according to the PRL, including fast ALS progressors (ALS-Fast; PRL>1, n=18, red code), intermediate ALS progressors (ALS-Intermediate; PRL 0.5–1, n=24; green code) and slow ALS progressors (ALS-Slow; PRL<0.5, n=32; blue code) in a follow-up period of 15 months from baseline (figure 2B, left panel). Mean longitudinal plasma NfH measurements (±SEM) revealed distinct patterns in the three ALS subgroups. In ALS-Fast patients, there was a steady decline in plasma NfH levels in the follow-up period, while plasma NfH levels in ALS-Slow patients remained stable during the first 6 months and later increased as the disease progressed. In ALS-Intermediate patients, an increase in NfH levels during the early follow-up period was followed by a decrease towards a later stage. Kaplan–Meier survival curves showed a clear separation of median cumulative survival between ALS-Fast and ALS-Slow–Intermediate patients (p<0.0001; figure 2B, right panel).

(A) A scatter plot showing total plasma neurofilament heavy chain protein (NfH) levels at different time points for 74 patients with amyotrophic lateral sclerosis (ALS) in a 15-month follow-up period from baseline. Median and IQRs are shown beside the total plasma NfH levels. (B) Left panel: longitudinal profiles of mean total plasma NfH levels are shown in red for ALS-Fast, in green for ALS-Intermediate and in blue for ALS-Slow in a 15-month follow-up period. Each sampling time point is reported as the time from baseline, together with the n number of samples from ALS-Fast, ALS-Intermediate and ALS-Slow subgroups. Error bars: ±SEM. Right panel: distinct curves representing cumulative survivals in the total follow-up period for ALS-Fast (red lines), ALS-Intermediate (green lines) and ALS-Slow (blue lines) subgroups. (C) Trajectories of total NfH levels in the follow-up period for individual with ALS (dashed lines) and predicted average trajectories (solid lines) are shown for ALS-Fast (red), ALS-Intermediate (green) and ALS-Slow (blue) patients. ALS-Fast: overall progression rate >1.0; ALS-Intermediate: overall progression rate 0.5–1.0; and ALS-Slow: overall progression rate <0.5.
The predicted average trajectories of total plasma NfH levels over the first 15 months of follow-up for each of the three patients with ALS subgroups from the multilevel model are shown in figure 2C (solid lines), along with trajectories for observed total plasma NfH levels for each individual patient with ALS in each subgroup (dashed lines, figure 2C). No difference in total plasma NfH levels was observed at baseline between the three subgroups but there was some evidence of a difference in the average monthly change in total plasma NfH levels between the ALS-Slow (mean (95% CI): 0.20 (−0.47 to 0.86) ng/mL per month) and the ALS-Fast (−0.90 (−1.90 to 0.10) ng/mL per month) groups over the 15-month follow-up period (p=0.07). There was no evidence of a difference between the rate of change in total plasma NfH between the ALS-Slow and the ALS-Intermediate (0.19 (−0.74 to 1.11)) ng/mL per month) groups (p=0.99).
Changes in plasma NfH levels in the follow-up period do not predict patterns of disease progression
Changes in NfH levels and ALSFRS_R scores in the follow-up period developed according to four main patterns: (1) increasing NfH levels with a progressive decline of ALSFRS_R scores; (2) decreasing or no change of NfH levels with a progressive decline of ALSFRS_R scores; (3) decreasing or no change of NfH levels with steady ALSFRS_R scores and (4) increasing NfH levels with steady ALSFRS_R scores. Statistical analysis showed that increasing NfH levels did not predict deterioration in function, expressed as a decline of ALSFRS_R scores (Fisher exact test, p=0.07 and 0.17 for NfHSMI34 and NfHSMI35).
Changes in plasma NfH levels between visits and disease progression
We have examined the correlation between the ALSFRS_R slope ((ALSFRS_R score at second visit −ALSFRS_R score at first visit)/time between visits in months) (see online supplementary table S1), an indicator of disease progression, and the plasma NfH levels at the later visit, using data from 206 ‘pairs’ of consecutive visits from our longitudinal cohort of 74 ALS individuals. The ALSFRS_R slope ranged between −9 and 3 (mean±SEM=−0.866±1.34; median (IQR): −0.5 (−1.33, 0)). There was a mild positive correlation between the ALSFRS_R slope and NfHSMI34 levels (r=0.186, p=0.009; both panels, figure 3A), but no correlation between the ALSFRS_R slope and NfHSMI35 levels (r=0.076, p=0.281; data not shown). The correlation was strengthened for NfHSMI34and NfHSMI35 levels (NfHSMI34: r=0.256, p=0.01, left panel, figure 3A; NfHSMI35: r=0.215, p=0.032, data not shown), when only those patients with a relatively faster progression were included in the analysis (ALSFRS_R slope between −9 and −0.5). Lower plasma NfH levels correlated with a faster decline in the ALSFRS_R score, in line with our longitudinal analyses (figure 2), where patients with ALS-F had lower plasma NfH levels during the more advanced stages of disease and more marked (mostly negative) ALSFRS_R slopes between visits.

(A) A scatter plot showing the correlation between the amyotrophic lateral sclerosis functional rating scale revised (ALSFRS_R) slope between consecutive visits (ALSFRS_R score second visit minus ALSFRS_R score first visit)/time between visits in months) and the plasma NfHSMI34 levels at the later visit. There was a correlation between the ALSFRS_R slope and NfHSMI34 levels in 206 visit pairs (r=0.186, p=0.009, left and right panels altogether), which was strengthened if only those consecutive visits recording a higher level of functional decline (ALSFRS_R slope between −9 and −0.5; left panel only; r=0.256, p=0.01) were considered. (B) The bar chart illustrates the variability of total plasma NfH levels in the follow-up period from baseline levels. In a subset of patients with ALS, total plasma NfH levels increase during disease progression to a maximum level (VMax; blue bar) while in another group, they decrease to a minimum level (VMin; red bar) from the baseline levels. Comparative analyses with control levels in cross-sectional studies would therefore be dependent on the sampling times in the disease progression. Healthy controls (HC): grey bar. Error bars: ±SEM. **p<0.01, ***p<0.0001. Kruskal-Wallis test.
Variability of NfH levels in the follow-up period
In our longitudinal ALS cohort, we have identified individuals whose plasma NfH levels increase from V1 in the follow-up period, reaching a maximum level (VMax) and individuals whose plasma NfH levels decrease from V1 to minimal levels (VMin). As shown in figure 3B, total plasma NfH levels in some patients with ALS (n=45) at V1 were significantly lower than their VMax levels and similar to those in HCs. Conversely, plasma NfH levels at V1 were significantly higher in another subset of patients (n=48) than the levels seen at VMin and in HCs (figure 3B).
The immune response to Nfs
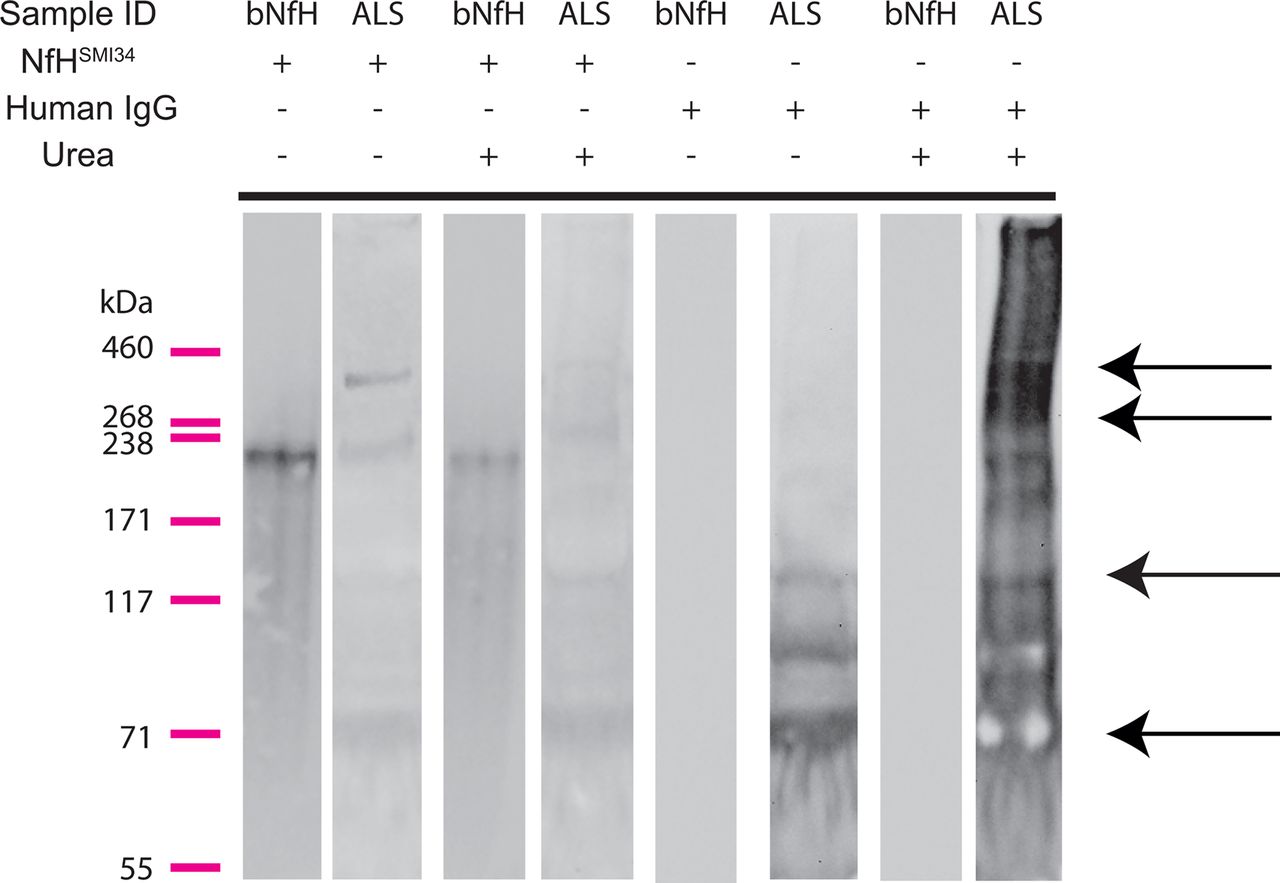
Autoantibodies against neuron-specific proteins have been previously detected in peripheral blood.26–30 Our western blot analysis showed high molecular weight (MW) NfH-stained bands (possible aggregates) in plasma from patients with ALS (second lane from the left side of panel; figure 4), partially dissociated into lower MW fragments by urea incubation (fourth lane from the left side of panel; figure 4), as previously shown in SOD1G93A mice that model ALS.24 No high MW aggregates or low MW fragments were observed in purified bNfH (the first and third lanes from the left side of panel, figure 4) as previously shown.24 After reprobing of the blot with antihuman IgGs, multiple intense bands for IgG at the same MW bands containing NfH high MW aggregates, monomers and fragments were detected (third lane from the right side of panel; figure 4, black arrows). This pattern was intensified by urea treatment (first lane from the right side of panel). These results indicate a colocalisation of NfH and IgG in the blot and support the concept of an immune response to NfH in the plasma of patients with ALS.
Immunoblots of plasma samples from patients with amyotrophic lateral sclerosis (ALS) and of purified bovine neurofilament heavy chain protein (NfH) proteins. NfH bands represent high molecular weight (MW) aggregates (238–460 kDa), monomers and NfH fragments (bands below ∼205 kDa) in plasma samples from patients with ALS (the second lane from the left of the panel), while only a monomer band for purified bovine NfH protein is displayed bovine NfH (bNfH, the first lane from the left of the panel). Urea partially dissolved the high MW NfH from ALS plasma as shown previously in superoxide dismutase1 (SOD1)G93A mice (the fourth lane from the left side of the panel), but had no effect on bNfH (the third line form the left side of the panel; refer J Neurosci Methods). After stripping of the NfH antibodies, the blot was reprobed with antihuman IgG (the four lanes from the right side of the panel). In ALS samples, multiple bands showing intense staining for human IgG were present at the level of NfH high MW aggregates, NfH monomers and NfH endogenous fragments and (black arrows), but not in the bNfH lanes (the second and fourth lanes on the right side).
Discussion
This study examined the role of plasma NfH phosphoforms, a recently emerged biomarker of axonal loss, in the clinical monitoring of ALS. Using a large and heterogeneous cohort of patients with ALS, we tested a sensitive plasma assay circumventing the need for CSF analysis and evaluated plasma NfH levels in cross-sectional and longitudinal cohorts. Our assay minimises the confounding effect caused by NfH aggregates (see online supplementary figure S1), increasing NfH detection yield in human, as previously shown in a mouse model of ALS.24 ,31
The relentless disease progression in ALS may suggest a linear change in time of any biological signal that reflects the underlying pathological process. The SOD1G93A mouse model of ALS, for example, displays a homogeneous and rapid disease course, where plasma NfH levels increase towards end-stage disease.32 The present study demonstrates that the situation in the human pathology is completely different, not least because of the significant heterogeneity of the disease (figures 2B and 3B). Our study suggests that plasma NfH levels in patients with ALS may reflect the speed of disease progression and the disease duration. However, there was ultimately no difference in plasma NfH expression between controls and ALS cases. Only a subset of ALS individuals with the shortest disease duration and faster progression rate showed tendentially higher but not statistically significant NfH levels than controls at baseline (figure 1).3 A wide range of plasma NfH levels were also observed in controls. The variability in NfH plasma expression may reflect the enhanced sensitivity of our assay, which minimises the ‘hook effect’ due to NfH aggregation in ALS and in control plasma samples (see online supplementary figure S1) and to the variable effect of autoantibodies against NfH. A reduced n number after stratification of our ALS cohort and the significant variability of plasma NfH levels may explain the lack of statistical power. While future studies with larger cohorts of ALS cases and controls may add to our initial findings, our results highlight potential limitations of plasma NfH measurements as prognostic biomarkers in ALS. An important learning point from our investigation is that the results of cross-sectional studies with limited case numbers and more homogeneous ALS cohorts should not be interpreted as a signature of ALS as a whole, but a random snapshot of a defined ALS phenotype and stage of disease development at the time when the sample is taken.
The characterisation of the longitudinal profiles of plasma NfH levels in our clinically heterogeneous ALS cohort was more meaningful if the prospective NfH measurements were stratified according to the speed of disease progression of the ALS individuals in the study. Fast progressors (ALS-Fast) appeared to have higher plasma NfH levels during the early stages of disease, but lower levels as they approached end stage (figure 2B, left panel); they also had the worst cumulative survival (figure 2B, right panel). The separation between trajectories of NfH levels in our fast and slow progressors appeared to be more marked towards the end of the follow-up period as our multilevel model of analysis demonstrates (figure 2C). This finding supports the importance of prospective measurements of a disease biomarker as a means to understand its true biological significance and its exploitability as an indicator of disease progression. The lack of any significant difference in plasma NfH levels at baseline between ALS-Fast and ALS-Slow and of steady trajectories of expression in the longitudinal analyses argue against the use of plasma NfH as prognostic biomarkers and as a suitable indicator of treatment response. Plasma NfH levels appear to be a good surrogate measure of treatment response in a predictable animal model of ALS, where plasma NfH levels surge with the disease progression.32 In humans, the clinical heterogeneity may impact on NfH homeostasis, making any inference on the relationship between plasma NfH levels, disease progression and treatment response very difficult. The observed immune response to NfH is also likely to speed up NfH clearance and/or have a masking effect over the epitopes recognised by the antibodies employed in our ELISA (figure 4).
The change in plasma NfH levels between consecutive visits may be a stronger indicator of disease progression. We observed a weak but significant correlation between lower plasma NfH levels and a more marked decline in the ALSFRS_R score between visits (a more negative slope indicates a faster progression; figure 3A). This finding appears to diverge from previous observations which supported a correlation between high levels of plasma and CSF NfH/NfL and a higher level of functional impairment.14 ,17 These studies correlated pNfH levels at baseline in a relatively small number of cases to the functional deterioration observed over short follow-up periods. Our study is more representative of the disease progression as we examine plasma NfH levels and functional deterioration in all available visit pairs (n=206), during a much longer follow-up period. Differences in the methods employed for NfH detection and in the composition of the ALS cohorts may have also played a part in the observed differences between our study and previously published data. Finally, it is possible that the clinical heterogeneity of ALS may be the main determinant of the different NfH expression profiles seen in plasma. Axonal loss is likely to occur during the unrecognised asymptomatic phase of the disease and as a result, in ALS-Fast patients, plasma NfH levels may peak early in the disease, decreasing later as the motor neuron population depletes. Conversely, increasing plasma NfH levels from initially low levels in ALS-Slow patients may reflect the slower pace of neurodegeneration compared with ALS-Fast patients.
The early loss of ALS-Fast patients, due to the aggressive nature of their disease, compared with the possibility of a more prolonged follow-up in ALS-Slow patients is likely to represent a bias in the statistical analysis which is central to the interpretation of our data. The inevitable drop in the number of longitudinal samples after baseline in ALS-Fast patients (figure 2B, left panel) increases the size of ‘missing data’ asymmetrically compared with the remaining patients with ALS, thereby reducing the sensitivity of simple repeated measurements in our longitudinal cohort. The specific nature of ALS poses other challenges in the analysis of any biomarker's disease trajectory, when compared with longitudinal studies in other neurological disorders. Unlike acute conditions such as spinal cord injury, which has a defined onset and can be followed-up with regular sampling during hospitalisation,33 neurodegenerative disorders such as ALS may start and progress subclinically, making any definition of disease onset and duration difficult. A regular pattern of follow-up and sampling of patients with ALS can also be difficult to achieve in an outpatient setting. By using a multilevel model, we have been able to include all individuals in the analysis under a ‘missing at random’ assumption,34 so that inconsistencies related to the incomplete follow-up periods can be minimised. We limited the effect of informative drop-out by restricting analysis to the first 15 months of follow-up. We also found that applying the method of Touloumi et al35 to account for informative drop-out in our multilevel model analysis did not meaningfully change the results from those presented here. Nevertheless, the importance of large, well characterised and consistent longitudinal cohorts remains paramount.
Our study provides a temporal segmentation of disease trajectories in ALS, based on clinical and biological measurements. From the results of the longitudinal study presented here, it is clear that the level of information that cross-sectional biomarker studies can provide in ALS is limited, as the results are critically dependent on the chosen sampling time in the study population (figure 3B).
A longitudinal analysis of a disease-relevant molecular signal should be included in the design of any study whenever possible. In clinical trials for example, a projected change of the area under the curve of the longitudinal measurements is one of the surrogate outcomes of treatment response. The a priori knowledge of the biomarker expression during the natural course of the disease and in its phenotypic variants would facilitate the recognition of treatment response. The ideal biomarker would have higher levels of expression in ALS compared with controls, would maintain steady levels throughout the disease course and would reflect the rate of neurological decline and the disease duration. Longitudinal analyses of plasma NfH levels in HCs should also be considered along with NfH studies in the general population stratified according to age, the main risk factors for neurodegenerative disorders. The lack of conditions likely to cause NfH release in our cohorts other than ALS was used to assume a relative temporal stability of plasma NfH levels in controls which were tested only at baseline. Future longitudinal biomarker investigations will certainly benefit from more integrated biological measurements including the analysis of the immune response to the proteins under investigation and by the development of multimodal investigations which would include, for example, imaging of the neuraxis to disclose additional features of axonal loss.
Acknowledgments
The authors thank all the participants and their families who kindly contributed to this project as well as our funding organisations (Motor Neurone Disease Association and Barts and The London Charity), without whose support this project would not have been possible. The authors also would like to thank the contribution made by Ann Cochrane, Louise Speigel, Elizabeth Jane Homan, Danise Sharon, Sarah Green in data collection and patient enrolment.
References
Supplementary materials
Supplementary Data
This web only file has been produced by the BMJ Publishing Group from an electronic file supplied by the author(s) and has not been edited for content.
Files in this Data Supplement:
- Data supplement 1 - Online figure
- Data supplement 2 - Online table
Footnotes
-
Contributors C-L undertook the laboratory work, data analysis and interpretation, performed the statistical analysis and wrote the first draft of the paper. AP contributed to the design of the study, laboratory work, statistical analyses and revision of the manuscript. JT and KA participated in laboratory work. CMW contributed to statistical analysis. RO, MF, KS, RH, JC and PF contributed to patient enrolment, data collection and revised the manuscript for content. JK, NP, and GG participated in conceptualising the study and revised the manuscript for content. LG contributed to the conceptualisation and design of the study, data interpretation and review and amendment of the manuscript. AM contributed to the conceptualisation and design of the study, patient enrolment, data collection, interpretation of the data, review and amendment of the manuscript. All the authors reviewed the drafts and approved the final version of this manuscript.
-
Funding This project was funded by The Motor Neurone Disease Association (Malaspina/Apr13/6097) and Barts and The London Charities (468/1714). LG is the Graham Watts Senior Research Fellow, funded by The Brain Research Trust and the European Community’s Seventh Framework Programme (FP7/2007-2013).
-
Competing interests None.
-
Ethics approval Ethical approval was obtained from the East London and the City Research Ethics Committee 1 (09/H0703/27) and written informed consent was obtained from 136 ALS patients (according to the El Escorial Criteria19) and 104 controls, seen at the University College London partners Motor Neuron Disease Clinics and at Musgrove Park Hospital, Somerset, between June 2009 and November 2012.
-
Provenance and peer review Not commissioned; externally peer reviewed.