Article Text

Abstract
Objective Damage to the cerebral tissue structural connectivity associated with amyotrophic lateral sclerosis (ALS), which extends beyond the motor pathways, can be visualised by diffusion tensor imaging (DTI). The effective translation of DTI metrics as biomarker requires its application across multiple MRI scanners and patient cohorts. A multicentre study was undertaken to assess structural connectivity in ALS within a large sample size.
Methods 442 DTI data sets from patients with ALS (N=253) and controls (N=189) were collected for this retrospective study, from eight international ALS-specialist clinic sites. Equipment and DTI protocols varied across the centres. Fractional anisotropy (FA) maps of the control participants were used to establish correction matrices to pool data, and correction algorithms were applied to the FA maps of the control and ALS patient groups.
Results Analysis of data pooled from all centres, using whole-brain-based statistical analysis of FA maps, confirmed the most significant alterations in the corticospinal tracts, and captured additional significant white matter tract changes in the frontal lobe, brainstem and hippocampal regions of the ALS group that coincided with postmortem neuropathological stages. Stratification of the ALS group for disease severity (ALS functional rating scale) confirmed these findings.
Interpretation This large-scale study overcomes the challenges associated with processing and analysis of multiplatform, multicentre DTI data, and effectively demonstrates the anatomical fingerprint patterns of changes in a DTI metric that reflect distinct ALS disease stages. This success paves the way for the use of DTI-based metrics as read-out in natural history, prognostic stratification and multisite disease-modifying studies in ALS.
Statistics from Altmetric.com
Introduction
The use of advanced MRI techniques, in particular diffusion tensor imaging (DTI) of white matter tracts, has greatly improved the understanding of the in vivo cerebral and spinal neuropathology of the adult neurodegenerative disorder, amyotrophic lateral sclerosis (ALS).1–5 DTI can quantify the integrity of large white matter tracts in vivo, using metrics such as fractional anisotropy (FA).6 A DTI-based in vivo imaging concept has also been applied to the recently introduced neuropathological staging system, indicating that ALS may disseminate in regional patterns.7 ,8 ALS overlaps with frontotemporal dementia clinically and pathologically. While the majority of patients with ALS do not develop a frank dementia, a large proportion show cognitive impairments on the same spectrum, and DTI has demonstrated extension of white matter changes into frontal and temporal lobes accordingly.9 ,10
Imaging biomarkers are urgently required for future pharmaceutical trials to be used as objective study endpoints. The development of robust prognostic and diagnostic markers has become a major research priority in this notoriously heterogeneous disorder.11 ,12 Effective biomarkers, particularly those integrated in therapeutic studies, need to be applicable across multiple international centres that, in case of MRI, may vary in their scanner hardware and sequence acquisition parameters.
The Neuroimaging Society in ALS (http://www.nisals.org) was established in 2010, and developed a roadmap for the standardisation and harmonisation of advanced MRI data in ALS.13 The most sensitive cerebral pathology found in cross-sectional MRI studies in patients with ALS has been in the white matter tracts,14 in contrast to the characteristic hippocampal atrophy that largely defines Alzheimer's disease. To date, there have been few large-scale multisite DTI studies, and none in ALS. Data analysis of such studies may be hampered by differences in scanning protocols,15 ,16 thus an approach to pool DTI data acquired with different protocols was sought. The objective was to identify ALS-induced alterations in the white matter structural connectivity in a large scale patient cohort from multiple sites spread across the world.
To this end, a new strategy has been developed that paves the way to use the large numbers of DTI data sets from local data bases of different study sites for comprehensive large-scale multicentre imaging studies.
Methods
Subject populations and scanning protocols
Four hundred and forty-two DTI data sets from patients with ALS (N=253) and control participants (N=189) from eight ALS-specialist clinic sites (tertiary referral centres) were selected ex post facto for this retrospective study (Dublin, Ireland; Edinburgh, UK; Jena, Germany; Miami, USA; Milano, Italy; Oxford, UK; Rostock, Germany; Ulm, Germany). Centre specific details, including number of participants and DTI scanning protocols, are given in table 1. Patients’ data were randomly selected for inclusion as they were available in the respective data bases of each site. All patients were diagnosed with ALS according to the revised El Escorial criteria,17 ,18 consistent with standard clinical criteria, by experienced ALS neurologists. Upper motor neuron signs were present in all patients. No patient had frank dementia. Severity of disease-related physical symptoms was measured using the revised ALS functional rating scale (ALS-FRS-R),19 and it ranged from 14 to 48 with a mean of 37±7 (96% ascertainment).
Number and demographics of participants and DTI scanning protocols of the multicentre setting
Ethics statements
Following the NiSALS governance guidelines, all data uploaded to the NiSALS repository were fully de-identified. As a safety measure against accidental disclosure of personal information, the data were run through a de-identification routine again after upload to the repository, which followed the recommendations of the NEMA organisation (http://medical.nema.org) in DICOM PS 3.15 2011—Security and Systems Management (ftp://medical.nema.org/medical/dicom/2011/09v11dif/09v11_15.doc), which lists the DICOM header fields that contain personal and protected information, including centre and scanner identifying information. These items were removed from the headers and new global unique identifiers were generated for each image slice. Data were then pooled and released to the analysis group. Therefore, the data analysed in this study contained no identifiable or protected information accessible to the investigators.
The local Ethics committees (EC) and specific EC reference numbers of all centres contributing data to this study, which allow for the sharing of fully de-identified data with scientific collaborators such as the exemption 4 of the 45 CFR 46 for the University of Miami site, were as follows:
Department of Neurology, University of Ulm, Ulm, Germany: The Ethics Committee of the University of Ulm: reference 19/12
Nuffield Department of Clinical Neurosciences, University of Oxford, John Radcliffe Hospital, Oxford, UK: South Central Oxford Ethics Committee: reference 08/H0605/85
Hans-Berger Department of Neurology, Jena University Hospital, Jena, Germany: The ethics committee of the Friedrich-Schiller-University Jena: reference 3633–11/12
Human Cognitive Neuroscience, Psychology–PPLS and Euan MacDonald Centre for MND Research & Centre for Cognitive Ageing and Epidemiology, University of Edinburgh, Edinburgh, UK: NHS Scotland A Research Ethics Committee: REC reference 08/MRE00/50
Quantitative Neuroimaging Group, Academic Unit of Neurology, Trinity College Dublin, Dublin, Ireland: Ethics (Medical Research) Committee—Beaumont Hospital, Dublin, Ireland: reference 08/90
Department of Radiology, University of Miami School of Medicine, Miami, Florida, USA: The University of Miami Institutional Review Board (IRB) approved the NIH-funded study: Brain MR Imaging and Spectroscopy of Amyotrophic Lateral Sclerosis, reference eProst ID: 20043623
Department of Neurology, University of Rostock and DZNE, Rostock, Germany: Medical Ethics Committee of Rostock University Medical: Centre: reference A 2011 56
Neuroimaging Research Unit, Institute of Experimental Neurology, Division of Neuroscience, San Raffaele Scientific Institute, Vita-Salute San Raffaele University, Milan, Italy: Ethical Committee of the Ospedale San Raffaele, Milano: reference RF-2010-2313220.
Preprocessing and whole-brain-based voxelwise comparison
Data from each centre were assessed for completeness and, according to an established analysis quality control, corrupted gradient directions (GD) in single DTI data sets were excluded from further analysis.20 The correction of eddy current-induced geometric distortions of the echo-planar imaging-based DTI data sets was performed prior to further analysis.21 Control for motion artefacts was also performed by use of the quality control algorithm.20 That way, specific image artefacts such as susceptibility-induced geometric warping, physiological and bulk patient motion, and chemical shift artefacts, could be removed from the single data sets from further processing. The application of this quality control and repair algorithm allowed those DTI data sets that contained some corrupted GD to not have to be excluded from the study. Out of the 442 data sets in total, 27 had to undergo the quality repair function.
Following a standardised iterative stereotaxic normalisation process, using study specific DTI template sets,22 FA maps of all participating participants were derived centrewise in Montreal Neurological Institute (MNI) stereotaxic standard space.
Cross-sectional group comparison analysis followed the procedure previously described in detail.22 Maps of FA were calculated from MNI-normalised DTI data, and a Gaussian smoothing filter of 8 mm FWHM was applied to the normalised individual FA maps. The filter size of 8 mm (which is about 2–3 times the recording voxel size, depending on the protocol) provides a good balance between sensitivity and specificity.23 ,24 Then, voxelwise statistical comparison (whole-brain-based spatial statistics, WBSS) was performed between the ALS patient group and the corresponding control group (refer to subsection ‘statistics’). Single-centre cross-sectional comparisons have already been reported in various studies.25 ,26
For the comparison of centres, a study-specific template set (b0 and FA) was created with equal weighting of centres, ALS-patients and controls; then, stereotaxic normalisation was performed repeatedly with these equally weighted templates.
Influencing factors of FA maps
Different factors may contribute to the variability of DTI data of control participants and ALS patients. Although the precise influence of each source of variation could not be delineated, investigating group FA differences between patients and controls on systematic between-centre differences was used to decide whether pooling across centres was feasible.24 Potential sources of variability directly or indirectly influence DTI metrics. Data from the eight centres differed especially in mean age of the participants and in recorded voxel size. These two parameters directly influence FA, which is known to be decreased in elderly participants,27 ,28 and, especially in complex fibre-tracking structures with different axonal directionalities, FA is decreased with larger voxel size.29 Further parameters, such as field strength (B0), echo time (TE) and number of GD, influence the signal-to-noise-ratio and thus indirectly influence FA values. Furthermore, centre-specific sources of variability on DTI metrics, for example, scanner specific variability, environmental noise and specific factors such as scanning time, might be present in single centre studies but will only slightly influence comparisons at the group level.24 Therefore, a strategy to regress out confounders in a two-step procedure was applied to controls’ data.
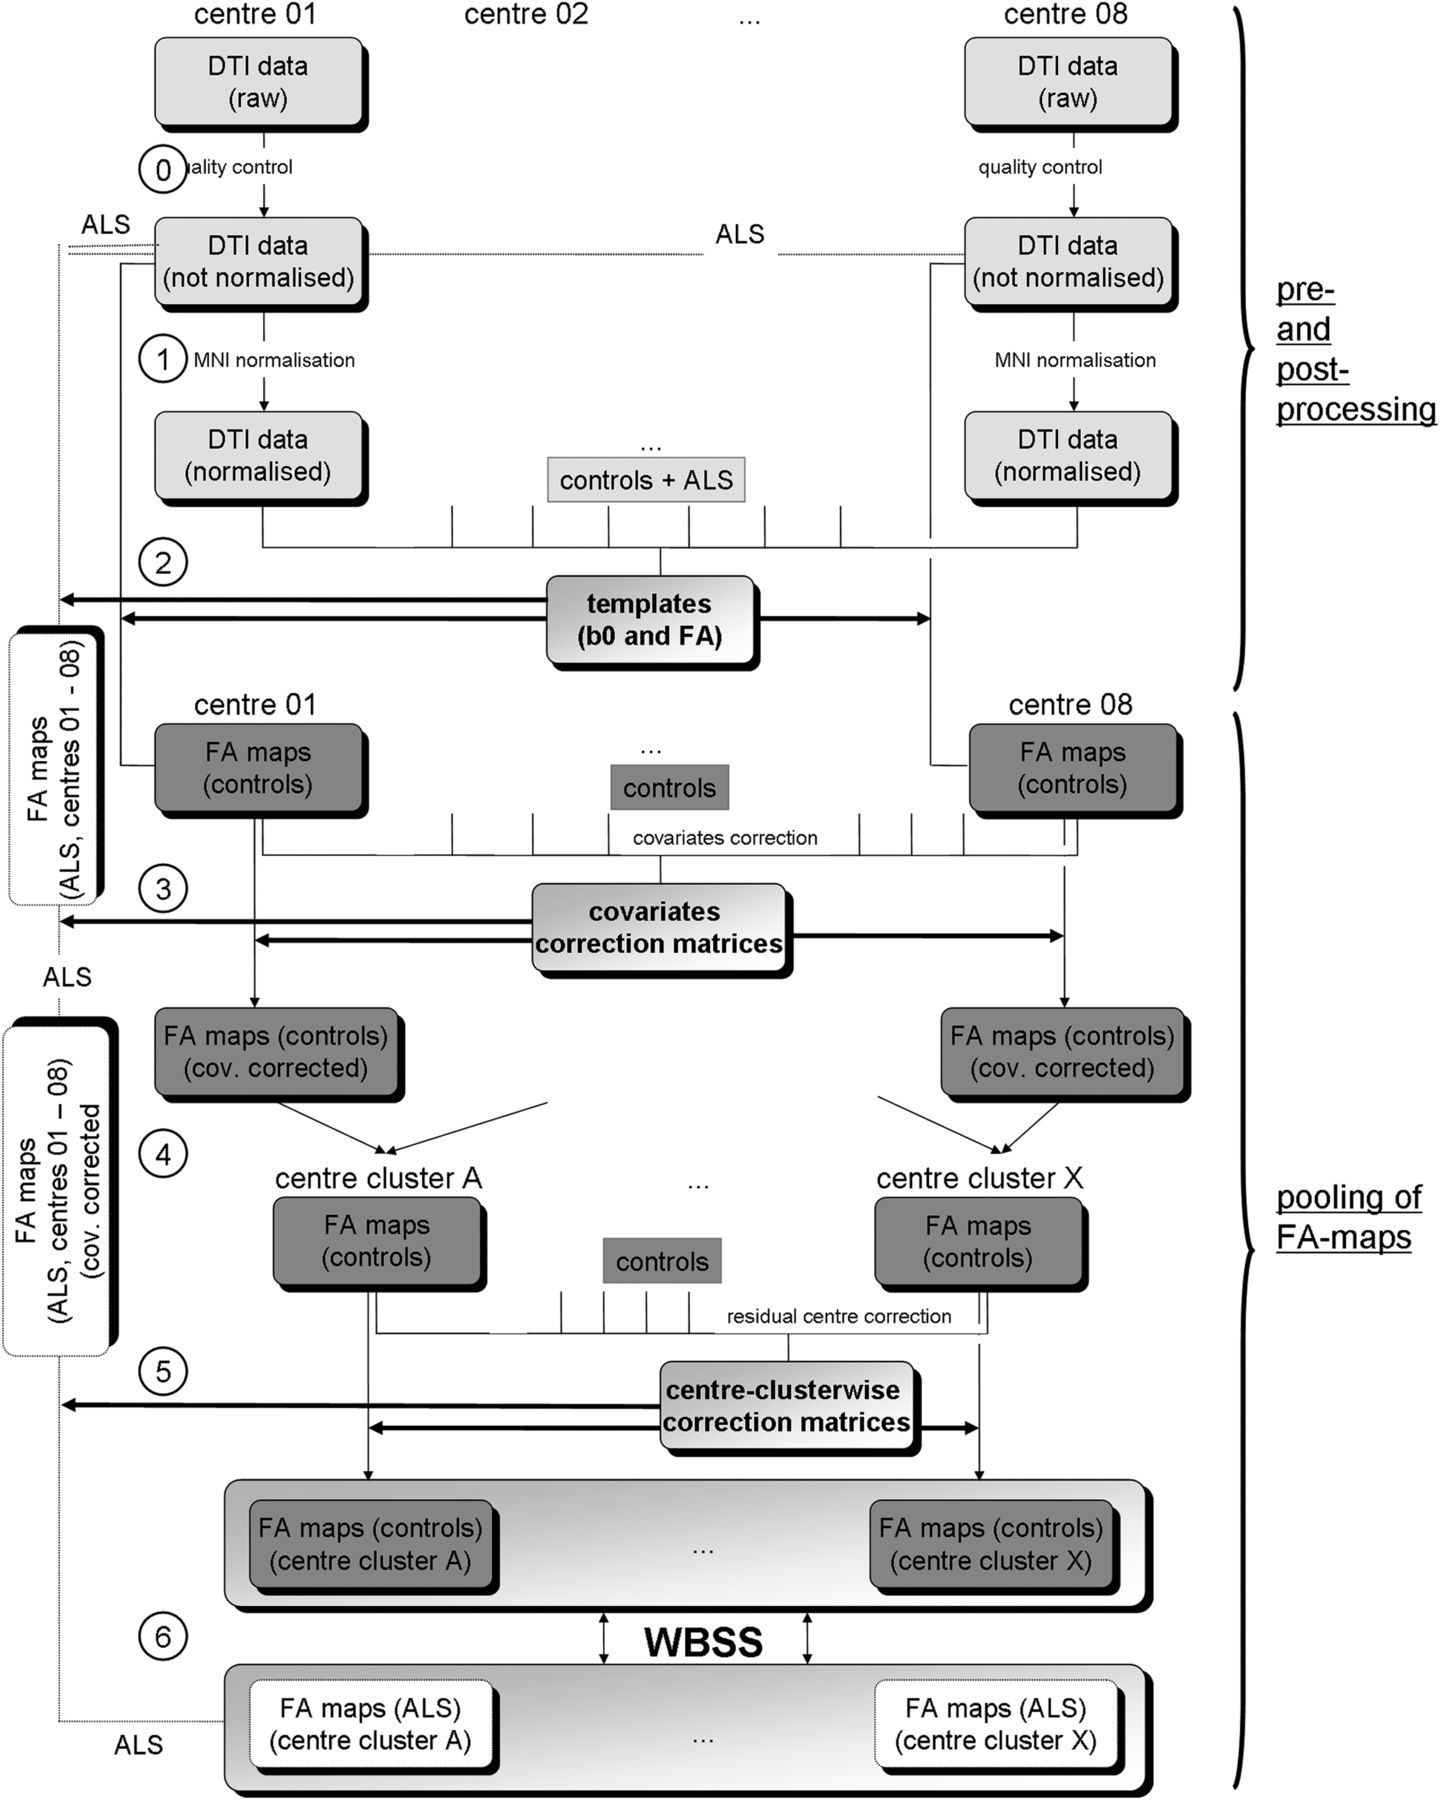
First, the covariates age, voxel size, TE, number of GD and B0 were regressed out in FA maps of controls, and a corrected FA map set consisting of FA maps of all controls was derived (figure 1). Corrections for asymmetrical voxel size were not performed as the orientation of the scans in different sites was not identical. In a second step, comparison of FA maps of controls was performed centrewise, and, if the number of significant voxels in the group comparison of controls was below a threshold of 10 000 voxels, centres were merged into centre-clusters. Finally, residual centre-specific influences (physiological and susceptibility artefacts, timing of scan, phenotype variations within the diagnosis of ALS, centre-specific environmental noise, etc) were defined together as intercentre effects. In a final step, three-dimensional (3D) linear correction matrices were calculated by computing the voxelwise differences of averaged FA values for the different centres.30 Owing to the limited number of control data sets of some centres, a voxelwise linear regression calculation30 with the respective 3D regression correction matrices was not possible. The linear 3D corrections were then applied to the FA maps of each centre (figure 1).

Schematic preprocessing and postprocessing and pooling of data. Upper panel (preprocessing and postprocessing): Data from each site underwent a quality assessment (0) where corrupted gradient directions in single DTI data sets (ALS and controls) were excluded for further analysis. In the next step (1), by a standardised iterative stereotaxic normalisation process (using study specific DTI template sets), FA maps (ALS and controls) were transformed into stereotaxic standard space (MNI space). For the comparison of centres, a study-specific template set (b0 and FA) was created with equal weighting of centres, patients with ALS and controls; then stereotaxic normalisation was performed repeatedly with these equally weighted templates (2). Lower panel (pooling of FA maps): For controls’ FA maps, the covariates voxel size, age, number of GD, B0 and TE were regressed out and a corrected FA map set consisting of FA maps of all controls was derived (3). The identical 3D-matrices for regressing out covariates in the control data sets were then applied to FA maps of patients with ALS (3). In the following step, centrewise pooling of FA maps of controls was performed by creating groups of centres that showed no relevant differences in FA maps of controls (4); centre grouping was performed simultaneously also for FA maps of ALS patients. Residual accompanying centre-specific influences, for example, timing of scan and phenotype variations within the diagnosis of ALS, were defined as intercentre effects and, in a final step, 3D linear correction matrices were calculated for the centres (5). The identical correction matrices were then applied to FA maps of ALS patients. Finally, WBSS (6) were applied to the pooled FA maps of patients with ALS and controls. Results were corrected for multiple comparisons at p<0.05. 3D, three-dimensional; ALS, amyotrophic lateral sclerosis; DTI, diffusion tensor imaging; FA, fractional anisotropy; FDR, false-discovery-rate; GD, gradient directions; MNI, Montreal Neurological Institute; TE, echo time; WBSS, whole-brain-based spatial statistics.
Centrewise pooling of ALS patients’ FA maps
For ALS patients’ FA maps, the covariates voxel size, age, number of GD, field strength and TE were regressed out with the 3D covariate regression matrices that were derived from the controls’ FA maps, and centre clusters were set up according to the classification derived for controls’ FA maps. Later, 3D linear correction matrices for centre clusters were applied (figure 1). A split-half stability test (splitting the eight centres to reach almost a split-half for patients with ALS and controls) was performed, comparing the results clusters of centres 03, 04, 06, 07, 08 (128 patients with ALS vs 98 controls) and the results clusters of centres 01, 02, 05 (125 ALS-patients vs 91 controls).
Statistics
WBSS was performed voxelwise by Student’s t test, with correction for multiple comparisons using the false-discovery-rate (FDR) algorithm31 at p<0.05 and a clustering procedure at a threshold cluster size of 512 voxels, to reduce type I and type II errors.24 Voxels with FA values below 0.2 were not considered for statistical analyses since cortical grey matter shows FA values up to 0.2.32 Voxelwise correlations between FA values and clinical scores (ALS-FRS-R) were calculated using Pearson correlation; corrections for multiple comparisons were performed using the FDR algorithm at p<0.05 followed by a clustering procedure at a threshold cluster size of 512 voxels. FA-based region-of-interest (ROI) analysis was performed by arithmetically averaging FA values of individual data sets within a spherical ROI of radius 10 mm. Voxels with FA values below 0.2 were not considered for statistical analyses. Comparisons between FA values of patients with ALS and controls were performed by Student’s t test.
Results
Single-centre voxelwise comparison of FA maps (WBSS)
The whole-brain-based voxelwise analysis of single centres’ FA maps without correction of confounding multicentric factors showed FA decreases mainly localised along the corticospinal tract (CST). From these single-centre analyses, no substantial alterations beyond the CST were detected. Centrewise cross-sectional results are provided in figure 2.

Centrewise and subgroup WBSS. (A) WBSS of the FA maps of the single centres. The comparison of FA maps from patients with ALS versus controls at single centre level (without correction of confounding multicentric factors) showed FA decreases mainly localised along the CST. NB: the number of significant voxels N was different for all centres. (B) WBSS of FA maps for centre clusters. The comparison patients with ALS versus controls of the FA maps of the centre clusters showed extensive FA decreases along the CST. NB: the number of significant voxels N was different for all centre clusters. (C) Stability test. WBSS in two groups of centres (with almost identical sample size) and centre numbers forming the two groups, are given. The comparison of FA maps from patients with ALS versus controls between these centre groups showed extensive FA decreases along the CST, and also in frontal areas and in the brainstem (at p<0.05, FDR corrected). Clusters of regional FA decreases are displayed on an averaged b0-template as background (coronal slice at MNI y=−20). ALS, amyotrophic lateral sclerosis; FA, fractional anisotropy; FDR, false-discovery-rate; MNI, Montreal Neurological Institute; WBSS, whole-brain-based spatial statistics.
Voxelwise correction of confounding factors
FA maps of controls showed significant correlations (p<0.05, corrected for multiple comparisons) to the covariates voxel size, age, number of GD, field strength and TE (see online supplementary figure S1A, upper panel). After regressing out these covariates, only small clusters of significant correlation to the aforementioned covariates remained. The application of the correction matrices to FA maps of patients with ALS also reduced the dependency on the covariates voxel size, age, number of GD, field strength and TE (see online supplementary figure S1A, lower panel). Centres were merged into centre-clusters. That way, centres 3b and 6 form a centre-cluster, and centres 3a, 5 and 7 form the reference centre cluster (see online supplementary figure S1B). Residual accompanying centre-specific influences in between centre clusters were corrected by 3D linear correction matrices, using centre-cluster C as a reference (see online supplementary figure S1C). WBSS of centre clusters are provided in figure 2B.
The whole-brain-based analysis was performed for uncorrected and for corrected FA maps of 253 patients with ALS and 189 controls, and demonstrated difference maps, as displayed in figure 3. Resulting alteration patterns were apparently very similar, but after correction, a more symmetric pattern between hemispheres was revealed; furthermore, no FA increase clusters remained and the resulting cluster showed an increased interconnectivity. Group comparison of corrected FA maps showed, in total, a number of approximately 170 000 voxels significant, whereas the group comparison of uncorrected FA maps revealed only approximately 140 000 voxels (figure 3).

Comparison of FA maps (uncorrected for centre differences and corrected) of patients with ALS versus controls. WBSS of uncorrected (upper panel) and corrected (lower panel) FA maps of the 253 ALS-patients versus 189 controls, thresholded at p<0.05, corrected for multiple comparisons. Clusters of regional decreases were displayed on an averaged b0-template as background. Red circles indicate differences. ALS, amyotrophic lateral sclerosis; FA, fractional anisotropy; FDR, false-discovery-rate; WBSS, whole-brain-based spatial statistics.
Multisite ROI analysis of FA maps
FA map analysis was performed in several ROIs that were located in white matter structures prone to be affected in the course of ALS.7 According to atlas-based MNI coordinates, ROI localisations were determined in the upper and central CST (MNI±22/−23/42 and MNI ±23/−22/1, respectively), in the frontal white matter (MNI±20/5/42 and MNI±23/−26/7), in the brainstem (MNI±12/−21/−15) and in the hippocampal area (MNI±36/−19/−14). This analysis was performed in the centrewise corrected and harmonised FA maps of 253 patients with ALS and 189 controls. The effect size in terms of significance of differences was higher the earlier the respective anatomical ROI structure was expected to be involved in the degenerative process according to the pathological spreading pattern predicted by postmortem pathology (see online supplementary figure S2A). In addition, effect sizes (p values) for the different ROIs are illustrated in online supplementary figure S2B, separately for the different centres. As for the whole data set, most significant results were observed along the CST for all single centres, followed by clusters in the frontal ROIs and the ROIs in the brainstem and in the hippocampal area.
Multisite voxelwise comparison of FA maps (WBSS)
The whole-brain-based analysis was performed for corrected FA maps of 253 patients with ALS and 189 controls, and demonstrated difference maps, as displayed in figure 4. Differences were connected within one large cluster covering an area of about 170 000 mm3 in the white matter p<0.05, corrected for multiple comparisons; this number of significant voxels was higher than computed by WBSS of ‘uncorrected’ FA-maps (approximately 140 000 m3). The split-half stability test (splitting the eight centres to reach almost a split-half for patients with ALS and controls) revealed a similar number of difference cluster voxels for both groups (figure 2C). The split-half test as well as the whole group analysis showed basically the same brain regions to be affected (although with a different number of cluster voxels): with respect to the tract specific analysis,8 major significances were found along the CST (corresponding to neuropathological stage 17), including the ‘horseshoe’ configuration (in coronal slicing), reflecting superior CST and transcallosal interconnecting fibres,33 frontal involvement including areas crossed by the corticopontine and corticorubral tracts (neuropathological stage 2), and the corticostriatal pathway (pathological stage 3), pathways to brainstem (pontine/rubral involvement, pathological stage 2) and hippocampal areas including the proximal portion of the perforant path (pathological stage 4) (figure 4A).

Cross-sectional comparison of FA maps of patients with ALS versus controls. WBSS of FA maps of 253 ALS-patients versus 189 controls, p<0.05, corrected for multiple comparisons. Clusters of regional decrease were displayed on an averaged b0-template as background. (A) Selective slice representations of the ALS-characteristic ‘horseshoe’ (ALS stage 1, corticospinal tract and corpus callosum), alterations of frontal lobes and of rubral and pontine areas (ALS-stages 2 and 3, corticopontine tract, corticorubral tract and corticostriatal pathway), and alterations of hippocampal regions (ALS-stage 4, proximal portion of the perforant path). (B) Projectional sagittal views for different display thresholds. Highest significance (p<0.00005, FDR corrected) was found in the upper corticospinal tracts, followed by (also high) significance (p<0.0005, FDR corrected) in both corticospinal tracts. Display of lower significance thresholds shows involvement of alterations of the frontal lobes (p<0.005, FDR corrected) and lowest significance threshold (p<0.05, FDR corrected) shows broader affectations to the frontal lobes and also to hippocampal regions. ALS, amyotrophic lateral sclerosis; FA, fractional anisotropy; FDR, false-discovery-rate; N, numbers of significant voxels; WBSS, whole-brain-based spatial statistics.
With the application of more lenient thresholding, a pattern resembling the neuropathological spreading could be demonstrated, beginning with highest significances (corrected p<0.00005, N=23 500) in the upper CST, followed by clusters along the CST (corrected p<0.0005, N=46 000), then including frontal areas (corrected p<0.005, N=83 500), and, at lowest significance level at corrected p<0.05 (N=162 200), also including brain stem as well as hippocampal areas (figure 4B). This pattern could also be replicated by uncorrected data with a reduced number of significant results voxels, that is, at corrected p<0.00005: N=15 300, at corrected p<0.0005: N=34 300, at corrected p<0.005: N=61 600 and at corrected p<0.05: N=134 600 (see online supplementary figure S3).
Following the theory of spreading patterns that could be expressed by ALS-stages,7 ,8 relations were investigated between the FA values and a clinical disability score, that is, the ALS-FRS-R. For this task, the samples of patients with ALS were stratified according to clinical disability at the time of scanning. Three age-matched and gender-matched groups that were homogeneously distributed over centres were selected, obtaining identical group size and gender ratio, and no significant differences in age distribution: 38 patients with ALS-FRS-R ranging from 44 to 48 years (m/f 20/18, mean age 58 years), 38 patients with ALS-FRS-R ranging from 31 to 43 years (m/f 20/18, mean age 62 years) and 38 patients with ALS-FRS-R ranging from 14 to 30 years (m/f 20/18, mean age 59 years) (figure 5). The group with mild ALS-FRS-R decrease showed a summed-up cluster of 11 400 mm3 to be affected as significant FA decrease, the group with moderate ALS-FRS-R decrease showed, in sum, 26 600 mm3 to be affected, and the group with moderate ALS-FRS-R decrease showed, in sum, 61 700 mm3 of regional FA decreases.

Comparison of FA maps of patients with ALS versus controls as stratified for disease severity (ALS-FRS-R). (A) WBSS of FA maps of ALS-patient subgroups as stratified for ALSFRS-R values versus controls at p<0.05, corrected for multiple comparisons. Clusters of regional decreases are displayed on an averaged b0-template. Projectional sagittal views: ALS-FRS-R range 44–48 (38 patients with ALS vs 189 controls), ALS-FRS-R range 31–43 (38 patients with ALS vs 189 controls) and ALS-FRS-R range 14–30 (38 patients with ALS vs 189 controls). (B) Voxelwise correlation of FA maps with ALS-FRS-R for 242 ALS patients, R>0.4, corrected for multiple comparisons, sagittal, coronal and axial projectional view. ALS-FRS-R, ALS functional rating scale; ALS, amyotrophic lateral sclerosis; FA, fractional anisotropy; FDR, false-discovery-rate; N, numbers of significant voxels; WBSS, whole-brain-based spatial statistics.
After corrections for covariates and centre differences, a significant voxelwise correlation of FA values and ALS-FRS-R was observed along the CST (R>0.4, corrected for multiple comparisons, figure 5B). Correlations were found for neither frontal areas nor for brainstem and hippocampal regions. NB: correlation analysis for uncorrected FA maps did not show any significant clusters for correlations between FA and ALS-FRS-R (see online supplementary figure S1).
Discussion
This pooled analysis of multisite MRI data demonstrated extensive motor and extramotor white matter tract pathology in a large number of patients with ALS compared to healthy controls. This is an important step in the development of DTI-derived biomarkers of neuropathology, which are applicable across multiple sites. FA is a marker of cerebral tract damage, demonstrated in multiple studies across a range of disorders, and so a natural candidate biomarker for ALS. It is a long way from formal validation as such, but if it is to be feasible as an outcome measure in a multicentre trial, then it will be necessary to assess across a large number of individuals from different centres and scanners. This is the first time such an analysis has been undertaken.
Previous imaging studies have investigated ALS-related alterations of white matter with group sizes of typically 15–30 patients and healthy controls.2 ,5 These studies have consistently detected reduced FA (and concurrently increased radial diffusivity) within the rostral corticospinal tracts and commissural callosal fibres. The current study, using an unprecedented number of participants, has revealed more widespread changes. By altering the significance threshold for group differences, a disease-specific pathological pattern of regional involvement was identified, which is consistent with postmortem histopathology findings.34 A deeper exploration of the data in relation to phenotype would be a logical next step but requires the provision of more detailed clinical information. The ALSFRS-R score is based on physical (motor) activities of daily living and is not obviously sensitive to frontal or hippocampal (non-motor) involvement. Nonetheless, mild ALS-FRS-R compared to moderate and severe ALS-FRS-R demonstrated pathological extension from pure CST involvement to involve the wider white matter.
Factors known to directly influence the FA are the voxel size29 and participant age.27 ,28 Indirect influencing factors on FA (via the signal-to-noise-ratio) are the field strength, number of gradients, pulse sequence and further centre specific factors. In DTI, multisite studies appear to be the best solution in order to improve the statistical power in investigation. Recent DTI studies reported replicability, reliability and stability of DTI-based FA measurements in multisite environments with common acquisition protocols. These analyses include a study with 26 patients with Alzheimer’s Disease and 12 controls on 16 scanners,16 a study with 9 controls on 2 scanners15 and a study with 2 controls on 5 scanners.35 Additional studies with harmonised DTI protocols have already been performed in Alzheimer’s disease as well as in Huntington’s disease.36 ,37 A framework for the analysis of phantom data in multicentre DTI studies has been previously provided.38 Reproducibility of DTI metrics has been recently tested in a sample of healthy controls at two identical scanners39 reporting that the within-session and between-session reproducibility was lower than the values for intersubject variability. The initial suggestions on how to correct for differences in FA maps with different protocols were recently published.30 ,40 Common acquisition protocols but involving different participants were investigated for groupwise FA differences between patients and controls on systematic between-centre differences.37 During the pooling process, a number of well-defined parameters that confound the FA results could be regressed out. Nevertheless, to some extent, residual centre-specific FA-influencing factors might be identified. That way, matrices for regressing out FA-influencing factors could be applied in an identical manner to FA-maps of ALS-patients. The comparison between the analysis of corrected and the analysis of uncorrected data showed a difference of about 20% in the number of significant voxels. However, as in this study the ratio patients/controls was approximately equal between the centres, the correction effects were less prominent, as it could be expected had the ratio patients/controls differed more between the centres. Furthermore, this study shows that affectations could be observed at the multicentre level with high subject numbers that would not have been possible to show in single- centre studies with low subject numbers, this methodological framework could easily be adapted to further DTI metrics, for example, radial, axial, or mean diffusivity.
In summary, this study has demonstrated that it is possible to meaningfully interpret combined DTI data from different MRI manufacturers and software platforms after application of appropriate compensations for centre-specific differences. This might pave the way to repurpose larger numbers of DTI data sets of patients with ALS for more clinically comprehensive large-scale multicentric imaging studies.
A limitation of this study compared to other multicentre studies of neurodegenerative diseases (eg, the PADDINGTON study in Huntington's Disease or the Alzheimer’s Disease Neuroimaging Initiative (ADNI)41 ,42) is the heterogeneous nature of DTI data resource in terms of magnetic field strength and acquisition sequence parameters used across the centres. It would be advantageous in a future prospective multisite study to try to harmonise as many data acquisition sequence parameters as possible. A further potential limitation of the current approach is the limited number of control data sets per centre, which may or may not be homogeneous over centres, and might lead to false or overcorrection. However, N=20 (which is the case in seven out of the eight centres) has been a standard control sample size in single-centre studies.33 ,43 ,44 As the ratio patients/controls did not differ strongly between different centres, a systematic centre difference would be averaged out in the multisite group comparison.
By this multicentre approach involving DTI data sets from more than 250 patients, it was possible to reveal the in vivo pathoanatomy of ALS non-invasively; the alteration pattern was found to be in agreement with postmortem neuroanatomical studies42 ,45 so that DTI seems to be prone to expand the potential of other neuroimaging markers such as fluorodeoxyglucose-positron-emission tomography in ALS.46 ,47 The postmortem cerebral white matter changes in ALS have been long recognised45 ,48 but direct correlation with DTI is still in development.49 This study represents a framework for mapping ALS-specific white matter tract alterations using DTI, and provides encouragement for its extension to other neurodegenerative diseases. In other diseases with emerging evidence of a consistent pathological pattern of spread,50 the white matter tract pathology will be closer to the underlying pathology than clusters of regional atrophy, and thus the DTI metrics have the potential to serve as read-outs and biomarkers of disease and its progression for future clinical trials.
References
Supplementary materials
Supplementary Data
This web only file has been produced by the BMJ Publishing Group from an electronic file supplied by the author(s) and has not been edited for content.
- Data supplement 1 - Online figures
Footnotes
Collaborators NiSALS contributors: Abdulla, Susanne, Department of Neurology, Hannover Medical School, Germany. Agosta, Federica, Neuroimaging Research Unit, Scientific Institute San Raffaele, Milan, Italy. Ajroud-Driss, Senda, Neurology, Northwestern University, USA. Atassi, Nazem, Neurology, Massachusetts General Hospital, USA. Bastin, Mark, Brain Imaging Research Centre, Centre for Cognitive Ageing and Epidemiology, University of Edinburgh, Edinburgh, UK. Benatar, Michael, Department of Neurology, University of Miami School of Medicine, USA. Brooks, William, Hoglund Brain Imaging Center, University of Kansas Medical Center, USA. Calvo, Andrea, Rita Levi Montalcini Department of Neuroscience, University of Torino, Italy. Cardenas-Blanco, Arturo, Plasticity and Neurodegeneration, DZNE, Germany. Chio, Adriano, University of Turin, Torino, Italy. De Carvalho, Mamede, Instituto de Medicina Molecular, Lisbon, Portugal. Dahnke, Robert, Department of Psychiatry, University Hospital Jena, Jena, Germany. Enzinger, Christian, Department of Neurology, Medical University of Graz, Graz, Austria. Ferraro, Pilar Maria, Neuroimaging Research Unit, Scientific Institute San Raffaele, Milan, Italy. Floeter, Mary Kay, SSPU, EMG section, National Institute of Neurological Disorders and Stroke, USA. Foerster, Bradley, Radiology, Division of Neuroradiology, University of Michigan, USA. Gaser, Christian, Department of Psychiatry, Friedrich-Schiller-University of Jena, Jena, Germany. Geraldo, Ana Filipa, Neuroradiology, HSM, Portugal. Gorges, Martin, Department for Neurology, University of Ulm, Ulm, Germany. Grehl, Torsten, Kliniken Bergmannsheil, Bochum, Germany. Groen, Georg, Section Neuropsychology and Functional Imaging, Department of Psychiatry, University of Ulm, Germany. Hardiman, Orla, Department of Neurology, Trinity College Dublin, Dublin, Ireland. Hartung, Viktor, Department of Neurology, University Hospital Jena, Jena, Germany. Jelsone-Swain, Laura, Department of Psychology, University of South Carolina Aiken, USA. Jenkins, Tom, Department of Neurology, Sheffield Institute for Translational Neuroscience, UK. Kalra, Sanjay, Medicine (Neurology), University of Alberta, Canada. Kasper, Elisabeth, University of Rostock, Rostock, Germany. Kitzler, Hagen, Department of Neuroradiology, Technische Universitaet Dresden, University Hospital, Dresden, Germany. Koritnik, Blaz, Institute of Clinical Neurophysiology, University Medical Center Ljubljana, Slovenia. Kuzma–Kozakiewicz, Magdalena, Medical University of Warsaw, Poland. LaFleur, Karl, Neurology/Psychiatry, University Medical Center—Utrecht, The Netherlands. Lulé, Dorothée, Neurology, University of Ulm, Ulm, Germany. Machts, Judith, Neurology, German Center for Neurodegenerative Diseases, DZNE, Rostock, Germany. Meoded, Avner, EMG, NINDS, USA. Pettit, Lewis, Human Cognitive Neuroscience, Psychology–PPLS and Euan MacDonald Centre for MND Research and Centre for Cognitive Ageing and Epidemiology, University of Edinburgh, Edinburgh, UK. Pioro, Erik, Neurology, Cleveland Clinic, USA. Poletti, Barbara, Department of Neurology and Laboratory of Neuroscience, IRCCS Istituto Auxologico Italiano, Italy. Pradat, Pierre-Francois, Department of Neurology, Pitie-Salpetriere Hospital, France. Prell, Tino, Department of Neurology, University Hospital Jena, Jena, Germany. Proudfoot, Malcolm, Clinical Neuroscience, University of Oxford, UK. Ratti, Elena, Neurology—Neurological Clinical Research Institute (NCRI), Massachusetts General Hospital, USA. Riva, Nilo, Neurology, San Raffaele Scientific Institute, Italy. Robberecht, Wim, Vlaams Instituut voor Biotechnologie, Leuven, Belgium. Ropele, Stefan, Department of Neurology, Medical University of Graz, Graz, Austria. Salachas, Francois, Assistance Publique-Hopitaux de Paris, France. Schmidt, Ruben, Neurology, UMC Utrecht, The Netherlands. Schmidt-Wilcke, Kliniken Bergmannsheil, Bochum, Germany. Schuster, Christina, Trinity College Dublin, Ireland. Shaw, Pamela, Sheffield Institute for Translational Neuroscience, Sheffield, UK. Sherman, Alex, Neurological Clinical Research Institute, Massachusetts General Hospital, USA. Silani, Vincenzo, Department of Neurology-Stroke Unit and Department of Neurology and Laboratory of Neuroscience, IRCCS Istituto Auxologico Italiano, Dino Ferrari Center, Department of Pathophysiology and Transplantation, Universita degli Studi di Milano, Milan, Italy. Spinelli, Edoardo Gioele, Neurimaging Research Unit, Institute of Experimental Neurology, San Raffaele Scientific Institute, Italy. Teipel, Stefan, Psychosomatik, University of Rostock and German Center for Neurodegenerative Diseases (DZNE), Rostock, Germany. Van Damme, Philip, Department of Neurology, KU Leuven, Belgium. Van den Berg, Leonard, University Medical Center Utrecht, The Netherlands. Van den Heuvel, Martin, Rudolf Magnus Institute of Neuroscience, University Medical Center Utrecht, The Netherlands. Verstraete, Esther, Neurology, University Medical Center Utrecht, The Netherlands. Walhout, Renée, Neurology, University Medical Center Utrecht, The Netherlands. Welsh, Robert, Radiology and Psychiatry, University of Michigan, USA. Weber, Markus, Kantonsspital St Gallen, Switzerland. Westeneng, Henk-Jan, Neurology, University Medical Center Utrecht, The Netherlands. Wittstock, Matthias, Department of Neurology, University of Rostock and DZNE, German Center for Neurodegenerative Disorders, Rostock, Germany. Yunusova, Yana, Speech-Language Pathology, University of Toronto, Canada.
Contributors H-PM was involved in the study concept and design, acquisition of data, analysis and interpretation, drafting of manuscript. MRT was involved in the acquisition of data, critical revision of the manuscript for important intellectual content. JG was involved in the acquisition of data, critical revision of the manuscript for important intellectual content. SA was involved in the acquisition of data, critical revision of the manuscript for important intellectual content. PB was involved in the acquisition of data, critical revision of the manuscript for important intellectual content. VG was involved in the acquisition of data, critical revision of the manuscript for important intellectual content. JP was involved in the acquisition of data, critical revision of the manuscript for important intellectual content. ACL was involved in the acquisition of data, critical revision of the manuscript for important intellectual content. MF was involved in the acquisition of data, critical revision of the manuscript for important intellectual content. JK was involved in the acquisition of data, analysis and interpretation, drafting of manuscript, study concept and design, study supervision.
Funding The data acquisition at the University of Miami was funded by the National Institutes of Health (USA) grant R01 NS060874. The data acquisition at the University of Ulm was supported by the German Research Foundation (Deutsche Forschungsgemeinschaft, DFG Grant Number LU 336/15-1) and the German Network for Motor Neuron Diseases (BMBF 01GM1103A). The image acquisition in Edinburgh was performed at the Brain Research Imaging Centre, a centre in the SINAPSE Collaboration, University of Edinburgh, and was funded by the Silvia Aitken Charitable Trust. The image acquisition in Milan was granted by the Italian Ministry of Health (Grant #RF-2010-2313220). The project was supported through the following funding organisations under the aegis of JPND—http://www.jpnd.eu (Project grant SOPHIA): France, Agence Nationale de la Recherche (ANR); Germany, Bundesministerium für Bildung und Forschung (BMBF); Ireland, Health Research Board (HRB); Italy, Ministero della Salute; The Netherlands, The Netherlands Organisation for Health Research and Development (ZonMw); Poland, Narodowe Centrum Badań i Rozwoju; Portugal, Fundação a Ciência e a Tecnologia; Switzerland, Schweizerischer Nationalfonds zur Förderung der wissenschaftlichen Forschung (SNF); UK, Medical Research Council (MRC).
Competing interests None declared.
Ethics approval Local ethics committees of the international contributing centres.
Provenance and peer review Not commissioned; externally peer reviewed.