Article Text

Abstract
Objective Survival and causes of death (COD) in multiple sclerosis (MS) provide ultimate endpoints. We aimed to investigate survival and COD in a 60-year population-based MS cohort compared with the general population.
Methods All patients with incident multiple sclerosis (MS) (N=1388) with onset during 1953–2012 in Hordaland County, Western Norway, were included. Data were obtained from patient records at Haukeland University Hospital and linked to the Norwegian COD registry. Survival adjusted for sex, age and disease course were estimated by Kaplan-Meier analyses from birth and from disease onset. Mortality and COD in MS relative to the general population were examined by standardised mortality ratio (SMR).
Results Of 1388 patients, 291 had deceased, mainly of MS (56.4%). Median life expectancy was 74.7 years for MS and 81.8 years for the general population (p<0.001); 77.2 years for women with MS and 72.2 years for men with MS (p<0.001). Life expectancy for patients with relapsing remitting MS (RRMS) was 77.8 years and 71.4 years for primary progressive MS (PPMS) (p<0.001). Overall SMR was 2.7 (p>0.0001); 2.9 in women and 2.5 in men (p=0.0009). SMR was 2.4 in RRMS and 3.9 in PPMS (p<0.0001). SMR from disease onset during 1953–1974 was 3.1; 2.6 during 1975–1996 and 0.7 during 1997–2012 (p<0.0083). No difference in cause-specific deaths were found (p=0.0871).
Conclusion We found a 7-year shorter life expectancy and almost threefold higher mortality in MS compared with the general population. A rise in survival in MS was observed during the entire observation period.
- Epidemiology
- Neuroepidemiology
This is an Open Access article distributed in accordance with the Creative Commons Attribution Non Commercial (CC BY-NC 4.0) license, which permits others to distribute, remix, adapt, build upon this work non-commercially, and license their derivative works on different terms, provided the original work is properly cited and the use is non-commercial. See: http://creativecommons.org/licenses/by-nc/4.0/
Statistics from Altmetric.com
Introduction
Longitudinal studies have revealed a promising change in longevity prognosis in multiple sclerosis (MS) with increased life expectancies in MS over the last decades.1–4 Similar survival trends have been seen also in the general population, questioning whether the gap in survival incidence between MS and the general population has changed over time.5 Patients with MS, on average, have shortened life expectancies by 7–14 years.4–7 Gender inequality for standardised mortality ratio (SMR) in disfavour of females has been reported despite a slower disability progression rate reported among women with MS and a longer life expectancy.8 9 In terms of disease course and mortality, a higher mortality rate among patients with primary progressive MS (PPMS) has been shown with respect to patients with relapsing-remitting MS (RRMS).2 4 MS, as noted on the death certificates has been reported as the the most common cause of death (COD) in patients with MS, and this trend has remained stable over time.2 7 10
COD analyses are important to quantify the nature and magnitude of underlying diseases, and, where possible, to compare COD in MS with COD in matched reference subjects. Here, we present results based on an observation time of 60 years on MS survival and cause-specific mortality, the longest follow-up study reported to date. This population-based study included all patients with incident MS in Hordaland County, Western Norway. Our main objective was to determine life expectancy in MS and to identify a potential change in survival between patients with MS and the general population during the observation period. Second, we aimed to compare mortality rates of cause-specific deaths in MS to the matched general population.
Methods
Settings and study design
All patients with onset of MS during 1953–2012 in Hordaland County were included in the study. Patient’s identification was obtained from patient records at the Departments of Neurology at Haukeland University Hospital and Haugesund Hospital, the only departments of neurology in Hordaland county, Western Norway. Additional records for patients with optic neuritis at the department of Ophthalmology, Haukeland University Hospital, were evaluated. For several decades, repeated surveys of MS epidemiology have been performed in these departments to maintain a continuous oversight and update of MS incidence and prevalence data.11 Patients were diagnosed as having definite or probable MS according to the criteria of Poser until 1 January 2001 and according to McDonald diagnostic criteria from 2001 and revised McDonald criteria (2010).12–14 Year of birth, age and age at onset (first clinical symptom) and at diagnosis, gender, disease course at onset (RRMS and PPMS), time period (year) for onset and diagnosis and COD were registered. Patient records were linked to the COD Registry at Statistics Norway for obtaining date and COD, classified according to the International Classification of Diseases (ICD-6, ICD-10). We used all entries recorded on the death certificates to ensure inclusion of all COD. However, only the primary COD was used in the sensitivity analysis, as all other causes were insufficiently recorded. The follow-up period ended 31 December 2012.
Expected life expectancy for the general Norwegian population according to age, gender and calendar year was based on yearly population mortality tables obtained from The Human Mortality Data Base (http://www.mortality.org/Public/CitationGuidelines.php).
The study was approved by the Regional Committee for Medical Research Ethics in Western Norway.
Statistical analysis
Descriptive methods were used to characterise the sample (demographic and clinic properties) The Fisher’s exact test was used to compare six categorical COD: MS, cardiovascular and cerebrovascular diseases, cancer, respiratory and infectious diseases, accidents and suicide and others according to gender and disease courses RRMS and PPMS.15 Survival curves for the observed MS population and in MS subgroups (gender, disease course) were assessed by Kaplan-Meier (log-rank) both from birth and from disease onset and compared with the (expected) mortality in the general Norwegian population.
The mortality rates for MS, MS subgroups (gender, initial disease course), age at onset and diagnosis, time period for onset and diagnosis and COD were compared with the general Norwegian population and assessed by SMRs.16 The SMR is the ratio of the observed patient mortality to the mortality for the general Norwegian population (expected) corresponding to age, gender and calendar year.16
All computation has been done in R.17
Results
Demographic and clinical data
Table 1 displays a total of 1388 patients with MS identified, 533 (38%) men and 855 (62%) women. Of these, 1209 (87%) patients were diagnosed with RRMS and 179 (13%) with PPMS. By 31 December 2012, a total of 291 (21%) patients had died. Of these, 131 (45%) were men and 160 (55%) were women.
Observed and expected number of deaths and standardised mortality ratios (SMR) by gender, disease course and periods for disease at onset, period for diagnosis, age at onset and age at diagnosis for patients with multiple sclerosis (MS) in Hordaland
Survival and all-cause mortality analyses
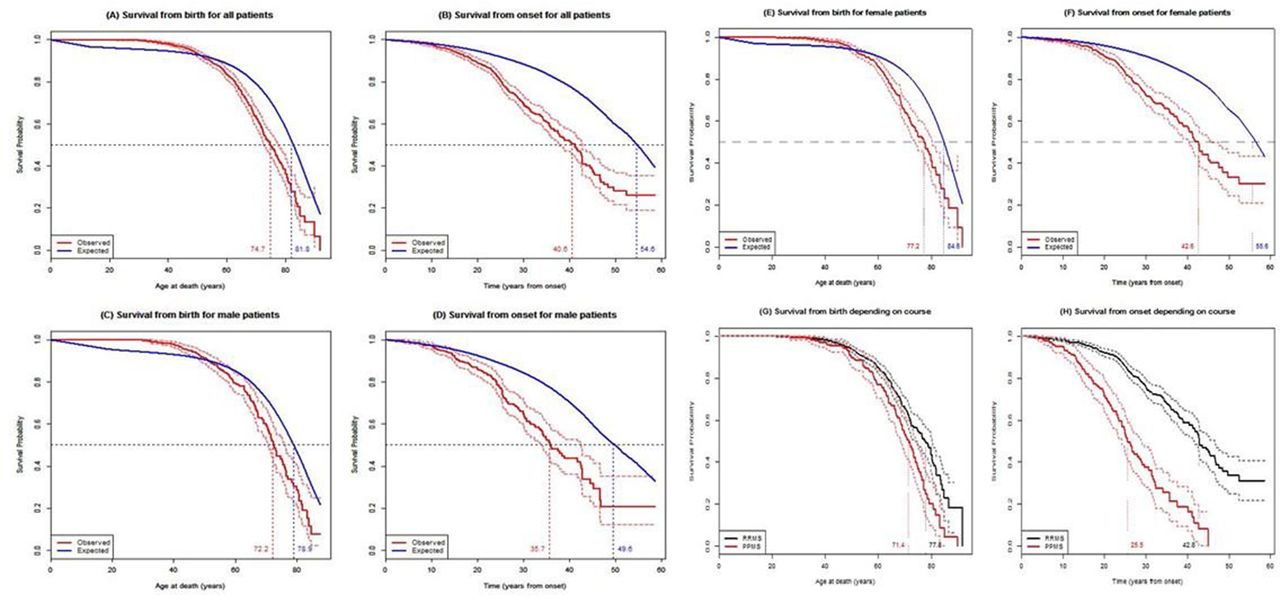
All Kaplan-Meier survival analyses are shown in figure 1A-H, found statistical significant differences at the level of p<0.001. Median life expectancy for all patients with MS was 74.7 years, compared with 81.8 years in the general population (figure 1A). Median survival from disease onset of MS was 40.6 years compared with 54.6 years in the general population (figure 1B). Men with MS had a median life expectancy of 72.2 years compared with 78.9 years among men in the general population (figure 1C). Median survival age from MS onset for men was 35.7 years compared with 49.6 years for men in the general population (figure 1D). Women with MS had a median life expectancy of 77.2 years, compared with 84.6 years among women in the general population (figure 1E). From onset, women with MS had a median life span of 42.6 years compared with 55.6 years for women in the general population (figure 1F). Patients with RRMS had longer life expectancy (77.8 years) than patients with PPMS (71.4 years) (figure 1G). In RRMS, median survival from onset was 42.8 years, compared with 25.5 years for patients with PPMS (figure 1H).
Kaplan-Meier survival curves of patients with multiple sclerosis (MS) in Hordaland county from birth (left column: A, C, E, G) and from disease onset (right column: B, D, F, H). A, B: Patients with MS versus the general population of Norway. E, F: Women with MS versus women in the general population of Norway. C, D: Men with MS versus men in the general population of Norway. G, H: RRMS versus PPMS. PPMS, primary progressive MS; RRMS, relapsing-remitting MS.
Data on mortality of all causes showed an overall SMR of 2.7 in MS compared with the general population (p<0.0001). SMR was 2.4 in RRMS and 3.9 in PPMS (p<0.0001) (table 1). In women, SMR was 2.9 and SMR was 2.5 in men (p=0.0009). SMR was 3.1 for disease onset during 1953–1974, 2.6 for disease onset during 1975–1996 and 0.7 for disease onset during 1997–2012 (p=0.0083) (table 1). Similar significant differences were observed for SMRs for analyses from the year of diagnosis; SMR was 3.0 for diagnosis during 1953–1974, 3.1 during 1975–1996 and 0.8 during 1997–2012 (p<0.0001). SMRs for 10-year intervals of age at disease onset were gradually reduced from 7.3 for those with disease onset before 20 years of age to 1.3 for those with onset above 60 years (p<0.0001) (table 1). Similar significant reduction were recorded for SMRs for 10–year intervals of age at diagnosis; SMR was 9.0 for diagnosis before 20 years of age and 1.6 for diagnosis after 60 years (p=0.0043) (table 1).
Cause of death
Table 2 displays the frequencies of causes of death in MS according to gender and disease courses and the mortality rate of cause-specific deaths between patients with MS and the matched general population. The main COD noted on the death certificates (immediate COD) was MS in 56.4% (n=164) of patients with MS. For all six CODs, no gender (p=0.35) or course specific (p=0.49) trends in death distribution were found. Cardiovascular and cerebrovascular diseases and cancer were in addition to MS most frequent, accounting for 14.8% (n=43) and 14.1% (n=41), respectively. Respiratory and infectious causes were recorded in 3.8% (n=11), accidents and suicide in 4.5% (n=13) and unknown cause was reported in 6.5% (n=19). There was no significant difference in SMR for all cause-specific deaths in MS compared with the general population (p=0.0871) (table 2).
Observed and expected number of causes of death and SMR for MS patients in Hordaland County and the general Norwegian population with onset during 1953–2012
Discussion
In this 60-year incidence-based population cohort from Western Norway, we demonstrated a median reduction in life expectancy of 7.1 years and overall an almost threefold increase in mortality rate in MS compared with the matched general population.
Our findings correspond to previous reports of MS mortality, and recent reports of 6–6.5 years survival reduction in similar studies in Canada and Spain.2 4 18 The median survival from disease onset was 41 years in MS, this is more than twice as long as reported in the first study on the topic in 1969 (17 years), reflecting a time trend towards a strong increase in life expectancy.4 19 Similar to others, we also found that patients with younger age at onset had a higher relative risk of dying (higher SMR) than patients with an older age at onset.2 4 Women with MS had 5-year longer life expectancy (77.2 years) than men with MS (72.2 years) irrespective of measured from birth or from disease onset. The same 5-year gender age difference in life expectancy was found in the general population, indicating that the longer survival age found in women with MS reflects the longer survival age found in women in the general population. In our study, the SMR for women (2.9) was significantly higher than for men (2.5), confirming data from previous studies.7 9 A Swedish nationwide study found an increased risk of heart failure and stroke in women with MS, similar to a previous Danish report.7 20 Women with PPMS have also been reported to have an increased hazard compared with men with PPMS.4 If women with MS truly have an increased mortality risk compared with men, further studies designed to investigate such a difference are, therefore, warranted. Global cardiovascular risk in MS, estimated by the Framingham Cardiovascular Risk Score, has recently been associated with increased MS disability and disease progression.21 With regards to investigating gender differences in mortality, added insight into the impact of gender-linked disparities in cardiovascular and lifestyle risk factors as well as treatment strategies and biological disease mechanisms would be warranted.20 22
Life expectancy has increased enormously in the general population during the 20th century.23 In most European countries, the life expectancy at birth was around 50 years in the early 1900s and has increased to approximately 75 years for men and 81 years for women in the year of 2000.23 One important reason for this improved survival has been the marked decline in cardiovascular diseases in advanced ages observed during the last decades.24 Multiple other factors have also likely contributed to this shift, such as general improvement in healthcare, better disability rehabilitation, socioeconomic development, better treatment for comorbid disorders, medical advances and lifestyle changes (smoking, diet, exercise, use of alcohol). In particular, the observed decline in smoking since the 1970–1980s have had a favourable impact on life expectancy.25
According to disease course in MS, we found that patients with RRMS outlived patients with PPMS by almost 7 years from birth, and the mortality risk (SMR) was twofold higher in PPMS compared with in RRMS. Consistent with our results, two previous studies reported similar observations.4 5 On the other hand, they found similar survival ages in RRMS and in PPMS, which was different from the findings of our study.
Whether the increased life expectancy and lower mortality rate in RRMS is/was influenced by the availability of efficient disease modifying treatments for RRMS as opposed to in PPMS is currently unknown.26 27
Analyses of COD patterns show that MS was the leading COD in more than half of cases, in line with existing data.2 7 18 27 However, no significant differences regarding the number of cause-specific deaths were observed between genders or disease courses. Also, when estimating the mortality (SMR) of cause-specific deaths no significant differences were found between the two populations. However, these results are probably influenced by the limited sample size in each category of listed causes of deaths.
The main strength of our study was the long duration of follow-up of a population-based incidence cohort, which increases the likelihood of the measured outcome to occur, as well as completeness and validity of data. The long period of observation also improves both quantity and quality of data on competing risks, as health problems can manifest themselves at all stages in life, although the occurrence of health issues more commonly increase with ageing. The main limitation of our study was the limited number of participants. Other limitations were mainly confined to the lack of information on lifestyle factors and comorbidities. The use of CODs based solely on death certificates have some limitations. The physicians responsible for filling out the death certificate forms are in many instances not the patient’s primary care physician and may lack relevant clinical information on the patients medical history. There is variation in coding practices and in accuracy in identification of COD.28 Moreover, COD listed on death certificates have shown discrepancies to the main diagnosis given at hospital discharge in patients who had been hospitalised during their final year of life and are also rarely autopsy confirmed.29 The time lag from onset to diagnosis of MS have decreased over recent years, hence, the incidence rates of MS at the beginning of this study might also have been underestimated. The study is a population-based study comprising all patients with disease onset during the study period and may include fewer benign cases in the first decades and more such cases in the latest years. However, since MS usually lead to increased disability with time, benign cases in the first decades were probably diagnosed later and included in the 60-year follow-up, limiting this possible bias. Improved diagnostic tools and diagnostic criteria as well as advancement in general healthcare have made earlier diagnosis of MS possible, factors that potentially could play a role in the observed improvement in MS survival in recent decades. However, our results are compatible with most previous studies in showing improved life expectancy in MS over time. Thus, indicating a probable effect from increasingly effective MS therapies and improved overall MS care, leading to reduction in complications from MS in advanced disease stages.30
When estimating the overall SMR during this 60-year follow-up time, a nearly threefold higher mortality rate in MS compared with the general population was recorded.9 Yet, irrespective of SMRs being measured from onset or from diagnosis, an overall significant increase in survival in MS compared with the general population was observed during the entire 60-year follow-up period. However, in the most recent time period (1997–2012), which showed a similar SMR (0.7) to the general population, the patients were in their early adulthood, and this SMR result should, therefore, be interpreted with uttermost caution. We studied the natural course of MS, and the availability of disease modifying therapies from mid-1990s could likely not have influenced our results. Also, incomplete treatment data and heterogeneous treatment strategies would have caused biases on treatment effect, if analysed. However, recent findings from a pivotal trial of the first available therapy of interferon beta 1b, showed a decreased mortality in the active treatment arm 21 years later.31 The rapid development of new disease therapies in MS and overall improved caretaking of the disabled during the last decades are thus promising for future improvements of survival and life expectancy in MS.
However, to estimate future trends in life expectancy more accurately, it is crucial to facilitate and take advantage of MS registries with detailed information on the use of disease modifying treatment as well as comorbidities and lifestyle factors.
Acknowledgments
The authors thank Dr Øyvind Torkildsen for helpful discussions regarding the manuscript.
References
Footnotes
Contributors H-MBL: study concept and design, acquisition of data, analysis and interpretation of data, wrote the manuscript. JA: statistical analysis and interpretation of data. K-MM: study concept and design, critical revision of manuscript for intellectual content. LB: interpretation of data, critical revision of manuscript for intellectual content. NG: study concept and design, acquisition and interpretation of data, critical revision of manuscript for intellectual content, study supervision.
Competing interests None declared.
Ethics approval The study was approved by the Regional Committee for Medical Research Ethics in Western Norway.
Provenance and peer review Not commissioned; externally peer reviewed.
Correction notice Since this paper was first published online there have changes to the author names and the affiliation the Department of Clinical Medicine, University of Bergen, Norway.
Linked Articles
- Editorial commentary
- Editorial commentary
- Multiple sclerosis