Article Text

Abstract
Background Perihaematomal edema (PHE) expansion rate may be a predictor of outcome after intracerebral haemorrhage (ICH). We determined whether PHE expansion rate in the first 72 hours after ICH predicts outcome, and how it compares against other PHE measures.
Methods We included patients from the Virtual International Stroke Trials Archive. We calculated PHE expansion rate using the equation: (PHE at 72 hours PHE at baseline)/(time to 72-hour CT scan time to baseline CT scan). Outcomes of interest were mortality and poor 90-day outcome (modified Rankin Scale score of ≥3). Logistic regression was used to assess relationships with outcome.
Results A total of 596 patients with ICH were included. At baseline, median haematoma volume was 15.0 mL (IQR 7.9–29.2) with median PHE volume of 8.7 mL (IQR 4.5–15.5). Median PHE expansion rate was 0.31 mL/hour (IQR 0.12–0.55). The odds of mortality were greater with increasing PHE expansion rate (OR 2.63, CI 1.10 to 6.25), while the odds of poor outcome also increased with greater PHE growth (OR 1.67, CI 1.28 to 2.39). Female sex had an inverse relationship with PHE growth, but baseline haematoma volume had a direct correlation. Among other PHE measures, only interval increase in PHE correlated with poor outcome. There was no significant difference between the 2 measures of PHE volume expansion.
Conclusions Rate of PHE growth over 72 hours was an independent predictor of mortality and poor functional outcomes following ICH. Baseline haematoma volume and gender appear to influence PHE growth.
Statistics from Altmetric.com
Introduction
Perihaematomal edema (PHE) is a radiological marker for secondary injury following spontaneous intracerebral haemorrhage (ICH).1 PHE is hypothesised to occur following the activation of inflammatory pathways by haeme products.2 Studies assessing the association between PHE and ICH outcomes have yielded conflicting results, perhaps due to small sample sizes, retrospective design and selection bias, and heterogeneity in the measurement techniques and timing of imaging. For instance, the relative edema volume, a ratio obtained by dividing PHE by the baseline haematoma volume (HV),3 is limited by strong collinearity between PHE and HV and the tendency to be disproportionately higher in small haematomas compared with larger ones.3 Studies that measured absolute baseline PHE volume4 and interval increase in PHE over 24 hours5 have both shown that these measurements correlate with poor functional outcomes but not with mortality.
Although PHE evolves over the first week after ICH, its growth is believed to be fastest in the first 48–72 hours.6 We previously reported that absolute increase in PHE over 72 hours was associated with worse functional outcomes following ICH, particularly with basal ganglia ICH and haematomas <30 mL.7 In a single-centre cohort in which participants with significant intraventricular haemorrhage and warfarin-related ICH were excluded, we reported that PHE growth rate at 24 hours was independently associated with death or disability.8 However, at 72 hours, PHE growth rate correlated with functional outcome but not with mortality.8 This may have been due to the small sample size of the study that limited the power to detect a significant association. These results need to be replicated in a large multicentre cohort that has greater external validity. Emerging data suggest that PHE growth is a feasible biomarker for secondary injury that reduces the sample size in ICH studies required to find a statistically significant difference in outcomes, and is therefore a good clinical trial end point in phase II, proof-of-concept ICH trials.9 If PHE expansion rate is predictive of outcome in multiple independent cohorts, it may provide an attractive therapeutic target for future clinical trials aimed at improving outcome after ICH, a disease with a high rate of mortality and neurological morbidity and with no current therapy beyond blood pressure management.
The rapidity of edema enlargement is a time-sensitive function, and from a mathematical standpoint requires precise time-based plots. Unfortunately, neuroimaging in the clinical setting often tends to occur at variable time periods based on logistic factors such as patient's haemodynamic stability, bedside procedures, etc. Hence, we aimed to quantify PHE expansion more accurately by considering the exact time lapsed from the initial neuroimaging scan. In the present study, we quantified PHE expansion as ‘rate of growth per hour’ in the first 72 hours—the time period of rapid PHE growth. Our aim was threefold—one, to study the relationship between PHE expansion rate and ICH outcomes; two, to study factors associated with PHE expansion; and three, to compare PHE expansion rate with previously reported measures.
Methods
Patient selection
We used data contained in the Virtual International Stroke Trials Archive ICH (VISTA-ICH).10 Eligibility for VISTA required the following: (1) documented entry criteria into a trial, with a minimum of 50 randomised patients with ICH; (2) documented consent or waiver of consent from the local ethics board; (3) baseline assessment within 24 hours of stroke; (4) baseline assessment of neurologic deficit; (5) confirmation of ICH by cerebral imaging within 7 days; (6) outcome assessment between 1 and 6 months with a validated stroke scale; and (7) data validation through monitoring. The VISTA cohort used in this study consisted of patients in the placebo-controlled arm (non-surgical, non-intervention). Only patients presenting with non-contrast CT proven ICH within 6 hours of symptom onset, and with baseline clinical, radiological and laboratory data were selected. All patients had follow-up CT scan at 72 hours, and 90-day modified Rankin Scores (mRS). Patients with early death or withdrawal of life support (<72 hours) were excluded.
Demographics and ICH characteristics
Demographic variables of interest included age, sex, race and ICH risk factors (comorbidities). All patients had admission Glasgow Coma Scale (GCS) scores. Baseline data obtained on admission included systolic and diastolic blood pressures and coagulation parameters (international normalised ratio and partial thromboplastin time). HV and PHE volume were calculated using semiautomated planimetry and were read centrally within each specific trial by a single trial neuroradiologist. Haematoma expansion was defined as an increase in the absolute baseline HV by either 33% or ≥12.5 mL of that on the CT at 72 hours.11 PHE expansion rate was calculated by using the formula (PHE at 72 hours−PHE at baseline)/(time to 72-hour CT scan−time to baseline CT scan, in hours) and was quantified as mL/hour. Availability of exact timelines for the baseline and 72-hour CT scans in the VISTA database enabled us to accurately calculate the PHE growth rate for each patient.
Outcome measures
The primary outcome measures were 90-day mortality and poor outcome at 90 days defined as mRS of 3–6. Secondary outcome measure was predictors of PHE expansion rate over 72 hours.
Statistical analysis
The Mann-Whitney U test was used for continuous variables because they were not normally distributed. The Pearson χ2 test (Fisher's exact test when appropriate) was used for categorical variables. Binary logistic regression was used to assess the relationship between PHE expansion rate and ICH outcome variables. Covariates used for the regression models included age, admission GCS, baseline HV, lobar location, infratentorial location, intraventricular extension, warfarin use and time to baseline CT scan. These variables were identified based on significant relationships with outcome on the unadjusted analysis with p<0.05. To study variables associated with PHE expansion, we first performed bivariate linear regression to identify variables with significance of p<0.05. Logarithmic transformations were used when the relationship between the variable and PHE expansion was non-linear. These covariates were then included in the multivariable linear regression. Statistical analyses were performed using Stata (V.14.0, College Station, Texas, USA). All analyses were two-tailed, and significance level was determined by p<0.05.
Results
We included a total of 596 patients with ICH in the study. At baseline, median HV was 15.0 mL (IQR 7.9–29.2), and the median PHE volume was 8.7 mL (IQR 4.5–15.5) as shown in table 1. The median PHE expansion rate was 0.31 mL/hour (IQR 0.12–0.55). There were 110 deaths (20.9%), and 90-day poor functional outcome occurred in 367 patients (69.6%). PHE expansion rates were 0.51 mL/hour among patients who died (vs 0.17 mL/hour in those who survived) and 0.35 mL/hour among those with poor functional outcome (vs 0.12 mL/hour in those with good functional outcome) as seen in table 2.
Baseline demographics and ICH characteristics of patients with ICH
Multivariable analysis of rate of PHE growth on outcomes in intracerebral haemorrhage
In the logistic regression model adjusted for the aforementioned confounders, PHE expansion rate was associated with a higher odds of mortality (OR 2.63, 95% CI 1.10 to 6.25, p=0.03) and higher odds of poor functional outcome (OR 1.67, 95% CI 1.28 to 2.39, p=0.01). In the adjusted linear regression model that assessed factors associated with PHE expansion at 72 hours (table 3), female sex was associated with lower PHE expansion (β −0.09, p=0.01), while baseline haematoma volume had a direct relationship with PHE expansion (β 0.23, p<0.001).
Linear regression showing factors associated with PHE expansion at 72 hours
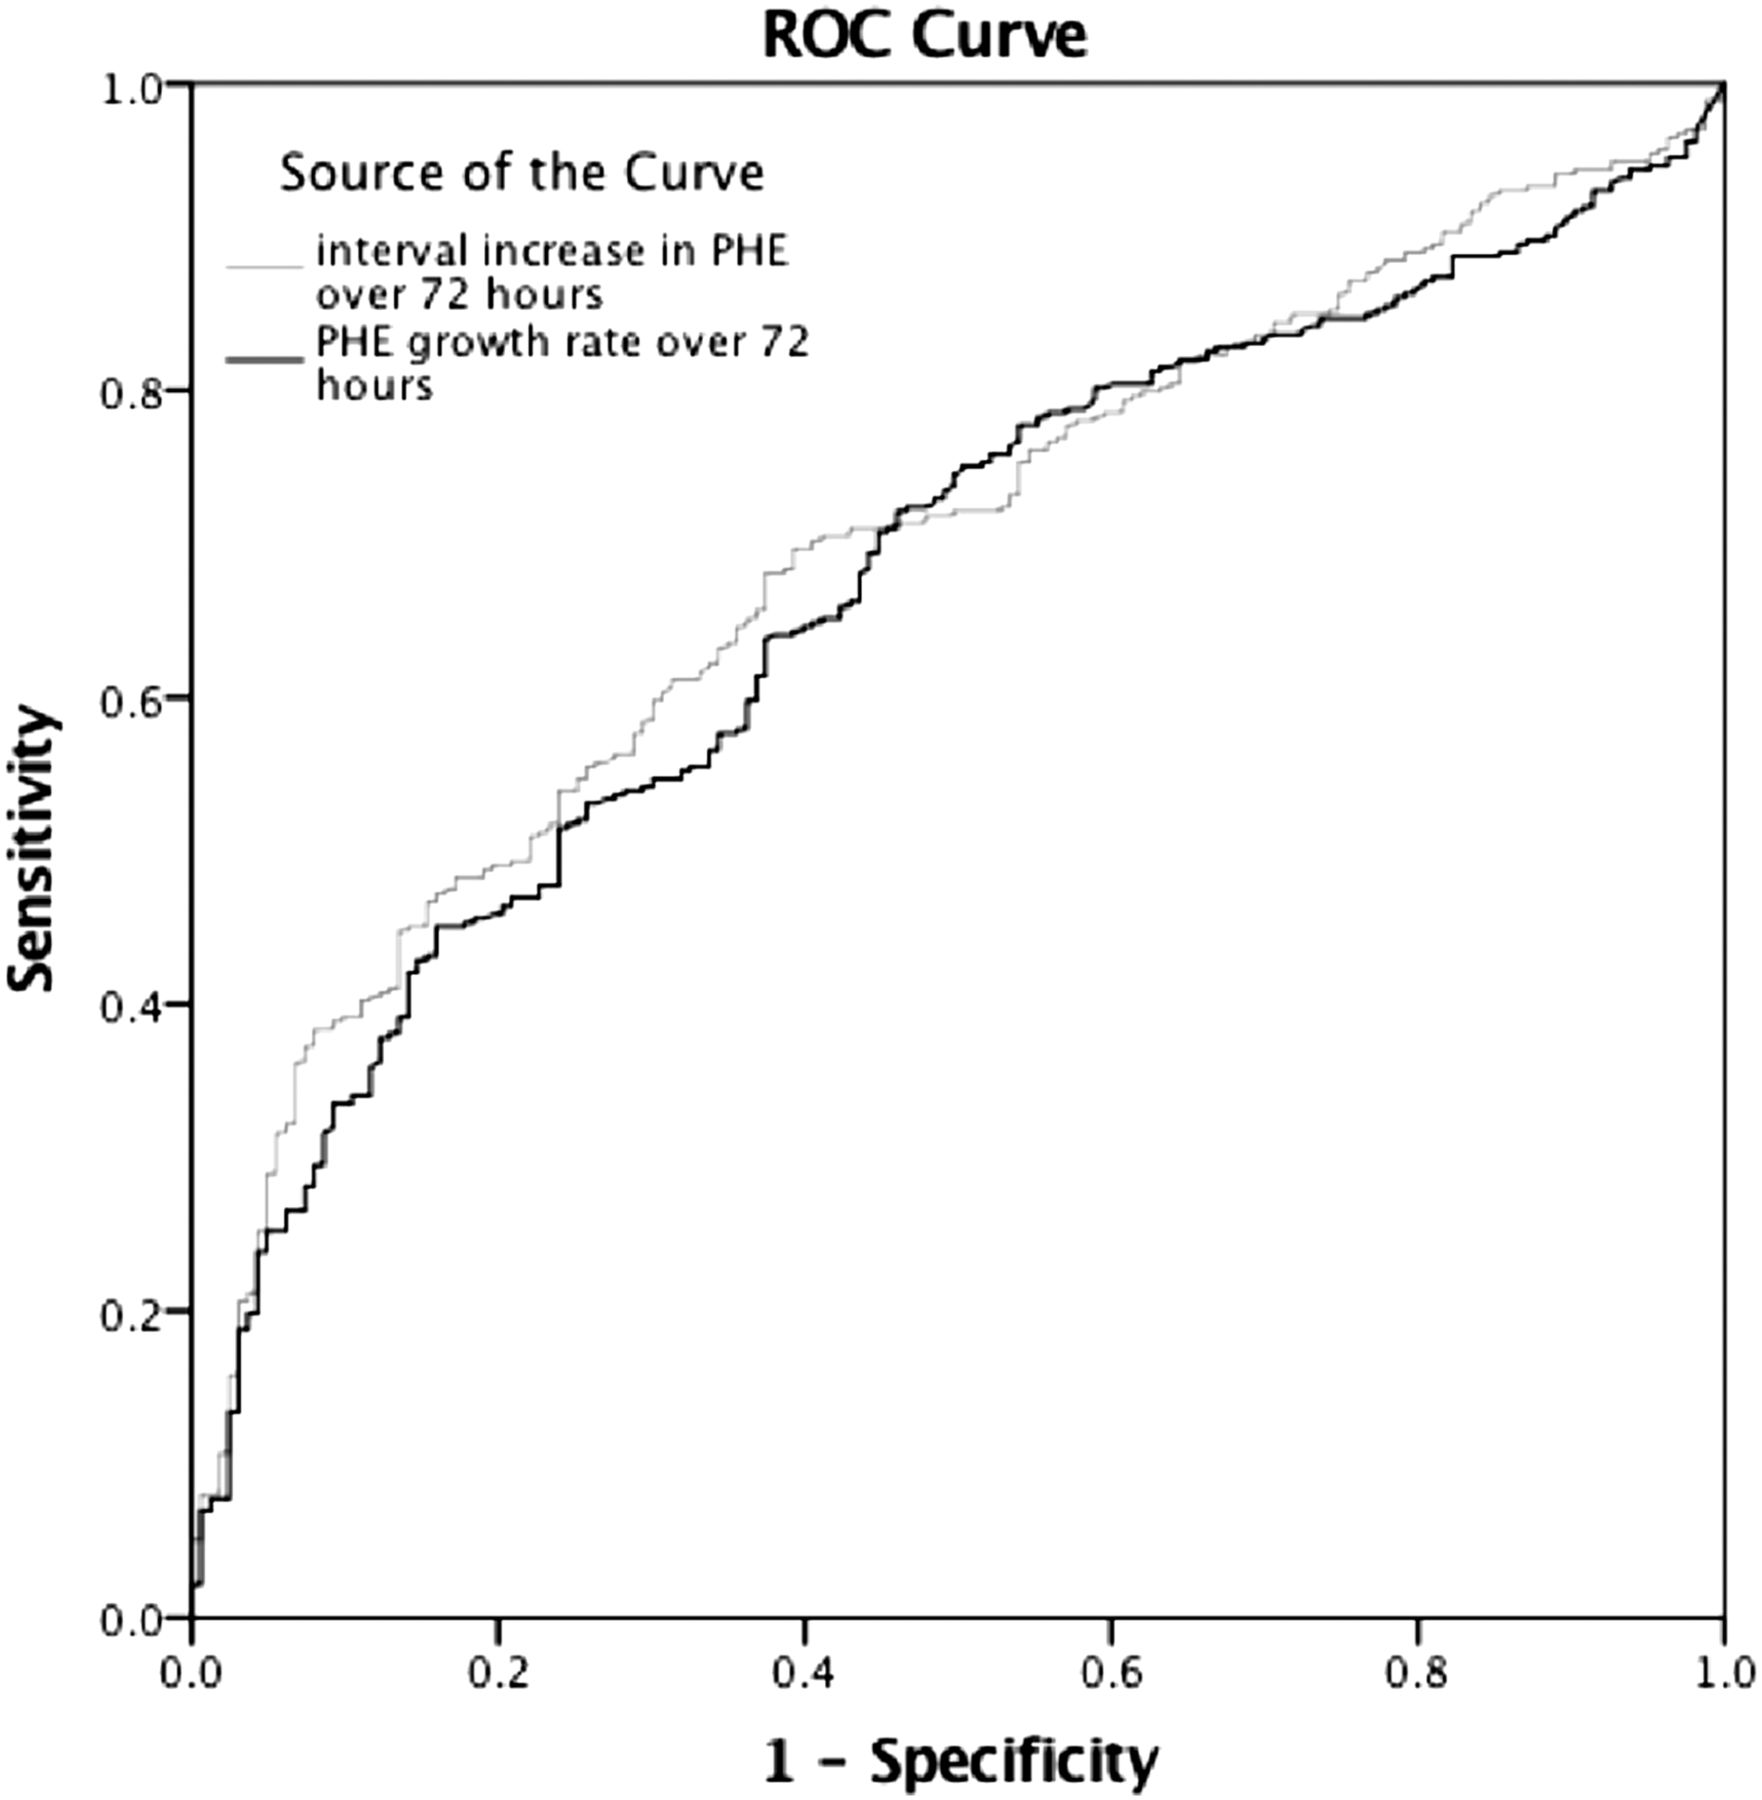
We then constructed regression models to assess the odds of poor outcome with other previously validated methods of measuring PHE (table 4). These included absolute PHE volume at baseline, absolute PHE volume at 72 hours, interval increase in absolute PHE volume over 72 hours and relative PHE volume at baseline. Of these measures, interval increase in absolute PHE volume over 72 hours was associated with poor functional outcomes (OR 1.78, 95% CI 1.12 to 2.64, p=0.01), and with mortality (OR 1.08, 95% CI 1.03 to 1.18, p=0.02). Higher absolute PHE at 72 hours had greater odds of poor functional outcomes (OR 1.02, 95% CI 1.01 to 1.04, p=0.03), but not with mortality (OR 1.02, 95% CI 0.98 to 1.04, p=0.09). The other PHE measures were not associated with ICH outcomes. Additionally, we plotted the receiver operator curves for PHE growth rate and interval increase in PHE volume over 72 hours (figures 1 and 2). We found no statistically significant difference between the two measures for mortality, with the area under the curve for PHE growth rate being 0.692 and that for interval increase in PHE 0.727 (p=0.690). Similarly, there was no difference for poor functional outcome either (p=0.783).
Multivariable analysis of rate of PHE volume using different PHE expansion definitions, on clinical outcomes in ICH
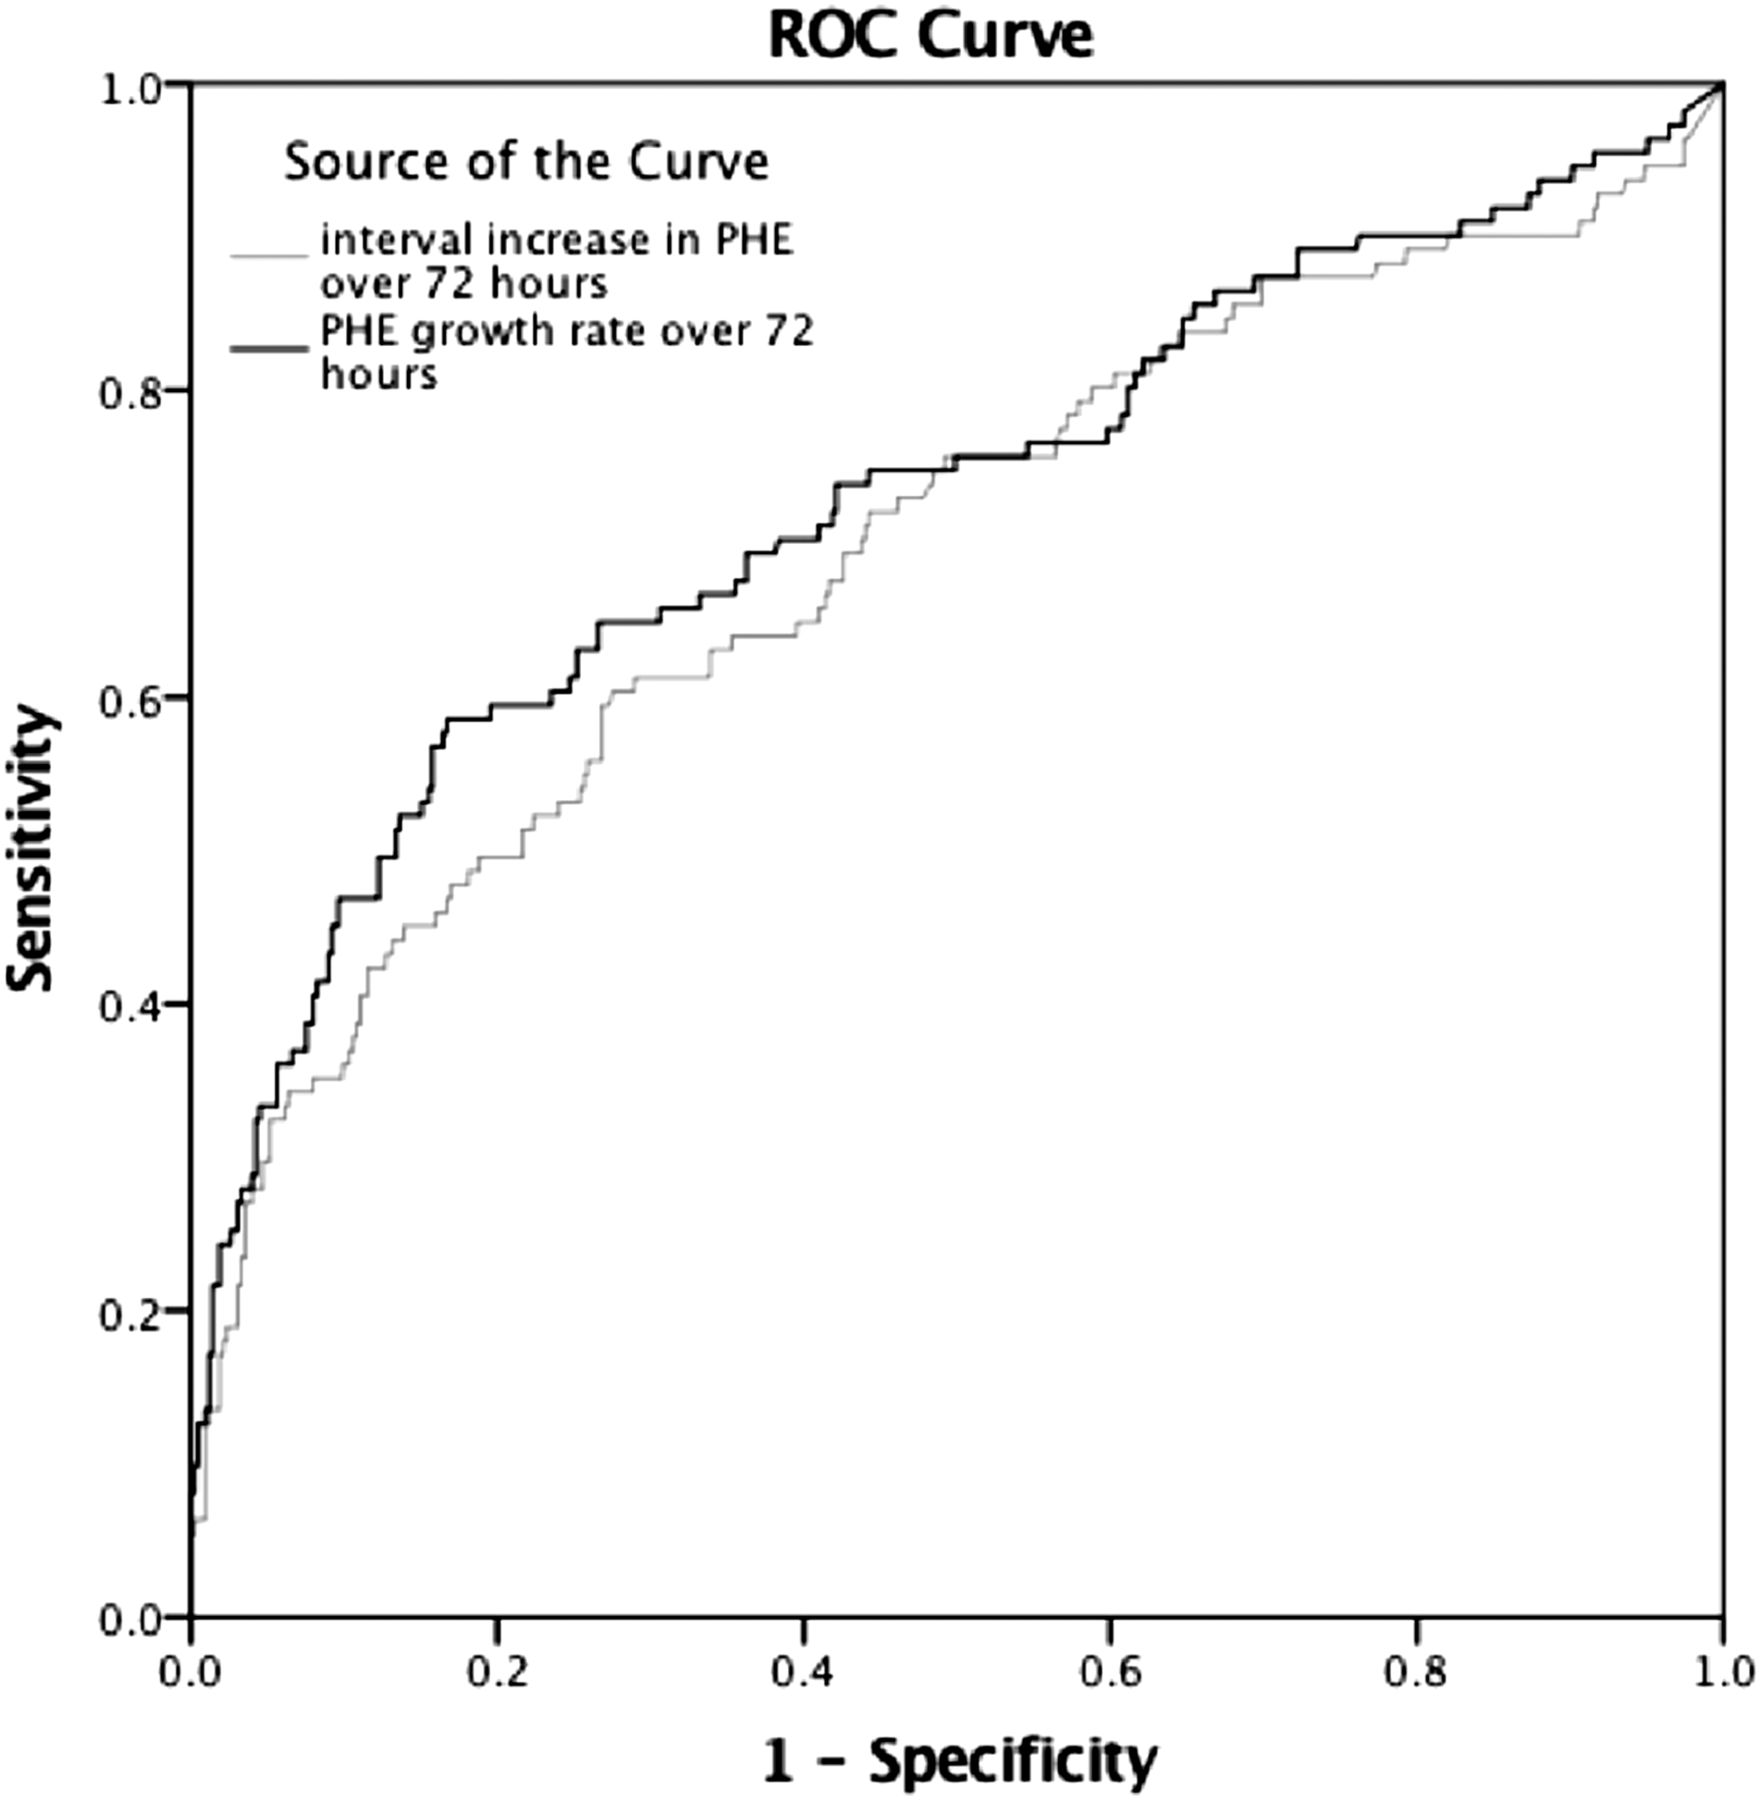
ROCs for mortality. Area under the curve for each measure. PHE growth rate: 0.692. iPHE: 0.727. PHE, perihaematomal edema; ROC, receiver operator curve.

Receiver operator curves for mRS 3–6. Area under the curve for each measure. PHE growth rate: 0.668. iPHE: 0.679. mRS, modified Rankin Scale; PHE, perihaematomal edema; ROC, receiver operator curve.
Discussion
In this large prospective pooled multicentre international trials cohort, PHE expansion rate was independently associated with poor outcome following ICH. PHE growth rate was three times higher in patients with poor outcomes. In comparison with previously studied PHE measures, PHE growth rate and absolute PHE increase over 72 hours were the only two measures that were associated with mortality and poor functional outcome.
A recent pooled analysis of the Intensive Blood Pressure Reduction in Acute Cerebral Haemorrhage Trial (INTERACT)—1 and 2 trials showed a significant association between PHE and functional outcomes but not with mortality.5 The use of interval increase in PHE volumes over a shorter time frame of 24 hours may have led to these results. A smaller prospective study measured absolute PHE volume at baseline and found similar results, but this study used a shorter timeline for outcome assessment (hospital discharge).4 We believe that because rate of PHE growth is fastest in the first 72 hours,6 using a slightly delayed timeframe for PHE measurement allowed us to capture PHE expansion more accurately, thereby accounting for the significant association with mortality. In our secondary analyses, while interval increase in absolute PHE volume at 72 hours correlated with mortality and poor functional outcomes, absolute PHE volume at 72 hours alone was associated with disability but not with mortality. This suggests that dynamic changes in PHE appear to influence ICH outcomes rather than the absolute PHE volume at a given time point. However, there was no difference between the two dynamic measures of PHE—rate of growth and interval expansion over 72 hours.
Baseline HV, in our study, was independently associated with PHE expansion, which corroborates results from prior studies.4 ,12 ,13 However, a noteworthy observation was that female patients had significantly lower PHE expansion compared with male patients. Previously Wagner et al14 reported similar findings and suggested a possible neuroprotective effect of oestrogen. In addition, more effective autoregulatory mechanisms in women may have contributed to lower PHE growth.14 From a pathophysiological standpoint, the underlying mechanism of development of PHE has not been elucidated fully, although animal data suggest the role of inflammation. Data from experimental ICH models have shown cytokines, matrix metalloproteinases, reactive oxygen species and thrombin play a role in secondary injury.1 However, there is a paucity of similar data in humans. In our study, PHE growth rate was almost three times faster in patients with ICH with poor outcome compared with those with good outcome. With recent evidence exploring PHE expansion rate as a potential biomarker for the inflammatory response,2 one may speculate whether higher rates of PHE growth may be attributed to a more severe inflammatory process.
The use of an ICH cohort with well-defined inclusion criteria and pre-established time points for data collection and CTs are inherent strengths of this study. Moreover, assessment of PHE up to 72 hours is well beyond the timeline used in prior studies. Exclusion of patients who underwent surgery is also a strength of this analysis, since decompression alters edema volume measurements and often obscures the association of edema and poor outcome.2 However, this exclusion limits the results of the present study to patients with ICH who do not have surgical intervention. This study has some important limitations. First, the ICH severity (based on GCS scores and HVs) in the VISTA patients is lower compared with those in the general population since these patients were selected from clinical trials, which affects the generalisability. Second, we assessed PHE growth for only the first 72 hours, although PHE evolves beyond this timeframe. Third, our method of PHE measurement assumes a uniform rate of PHE growth, which is unlikely to be the case. From a practical standpoint, obtaining multiple CT scans during the hospitalisations was not feasible. Hence pre-established timed assessments of PHE volumes at 0 and 72 hours ensured homogeneity. Data on body temperature or the use of osmotherapy, both known modifiers of PHE volume,15 ,16 were also not available. Finally, the VISTA database did not provide information on blood pressure control, which could potentially affect PHE volumes, although randomised studies have suggested evidence to the contrary.17 ,18
In conclusion, our study supports other work that dynamic change in PHE volume over time, whether PHE growth rate or absolute expansion in volume, is associated with poor outcomes after ICH. Further prospective confirmation with larger HVs would be useful. Targeting PHE growth appears to be an exciting avenue for new therapies for patients with ICH.
References
Footnotes
KNS and WCZ both contributed equally.
Collaborators VISTA-ICH Steering Committee: DFH (Chair), K Butcher, S Davis, B Gregson, KL, P Lyden, S Mayer, K Muir and T Steiner.
Funding SBM is supported by the American Brain Foundation and American Academy of Neurology. S. Urday received the 2014 American Heart Association's Student Scholarship in Cerebrovascular Disease and Stroke. LAB was supported by NIH-K12-NS049453. WTK is supported by NINDS K23NS076597. CI is supported by NIH grants R37NS089323-02, R01 NS034179-21, R01 NS037853-19 and R01 NS073666-04. HK is supported by NINDS grant K23NS082367 and the Michael Goldberg Stroke Research Fund. DFH was awarded significant research support through grant numbers 5U01NS062851 for Clot Lysis Evaluation of Accelerated Resolution of Intraventricular Haemorrhage III and for Minimally Invasive Surgery Plus r-tPA for Intracerebral Haemorrhage Evacuation (MISTIE) III 1U01NS08082.
Competing interests None declared.
Provenance and peer review Not commissioned; externally peer reviewed.