Article Text

Abstract
Objective Inflammation is a key pathological hallmark in amyotrophic lateral sclerosis (ALS), which seems to be linked to the disease progression. It is not clear what the added diagnostic and prognostic value are of inflammatory markers in the cerebrospinal fluid (CSF) of patients with ALS.
Methods Chitotriosidase-1 (CHIT1), chitinase-3-like protein 1 (YKL-40) and monocyte chemoattractant protein-1 (MCP-1) were measured in CSF and serum of patients with ALS (n=105), disease controls (n=102) and patients with a disease mimicking ALS (n=16). The discriminatory performance was evaluated by means of a receiver operating characteristic curve analysis. CSF and serum levels were correlated with several clinical parameters. A multivariate Cox regression analysis, including eight other established prognostic markers, was used to evaluate survival in ALS.
Results In CSF, CHIT1, YKL-40 and MCP-1 showed a weak discriminatory performance between ALS and ALS mimics (area under the curve: 0.79, p<0.0001; 0.72, p=0.001; 0.75, p=0.001, respectively). CHIT1 and YKL-40 correlated with the disease progression rate (ρ=0.28, p=0.009; ρ=0.34, p=0.002, respectively). CHIT1 levels were elevated in patients with a higher number of regions displaying motor neuron degeneration (one vs three regions: 4248 vs 13 518 pg/mL, p = 0.0075). In CSF, YKL-40 and MCP-1 were independently associated with survival (HR: 29.7, p=0.0003; 6.14, p=0.001, respectively).
Conclusions Our findings show that inflammation in patients with ALS reflects the disease progression as an independent predictor of survival. Our data encourage the use of inflammatory markers in patient stratification and as surrogate markers of therapy response in clinical trials.
- amyotrophic lateral sclerosis
- inflammation
- biomarker
- survival
Statistics from Altmetric.com
Introduction
Amyotrophic lateral sclerosis (ALS) is the most common motor neuron disease characterised by a progressive degeneration of both upper and lower motor neurons (UMN and LMN, respectively).1 2 The degenerative process is accompanied by inflammation of the central nervous system, consisting of microglial activation and infiltration of T lymphocytes and macrophages.3 In addition, proinflammatory cytokines, including interleukin (IL)-6, IL-8 and tumour necrosis factor alpha, and other circulating cytokines and chemokines, have been described to be upregulated in the cerebrospinal fluid (CSF) of patients with ALS.4 5 The upregulation of inflammatory genes in patients with ALS further supports an immunological component in the pathogenesis.6 Traditionally, neuroinflammation has been considered to be a response to motor neuron degeneration.6 However, studies in the SOD1 mouse model of ALS provided evidence that microglial activation was present before the onset of motor neuron degeneration, suggesting that inflammation might contribute to the disease progression in ALS.6 7 This concept was further supported by the activation of the complement system at the motor end-plates in the SOD1 mouse model of ALS prior to symptom onset.8 9 Also, circulating myeloid cells of patients with ALS had a proinflammatory phenotype,10 while regulatory T lymphocytes were decreased, enhancing neuroinflammation and disease progression.6 11 Furthermore, the ratio of neutrophils to CD16(−) monocytes was significantly increased in patients with ALS and correlated with the disease severity assessed by the revised ALS Functional Rating Scale (ALSFRS-R) score.12
This concept of inflammation contributing to ALS, however, is far from being consolidated. Indeed, it remains unclear when and how the immune system influences the course of ALS.6 For instance, the concentration and interaction between different cytokines varied in ALS as a function of the disease duration.13 Hence, different immune cells and cytokines may have a dominant role during each phase of the disease.12 14 Biomarkers of inflammation, such as chitotriosidase-1 (CHIT1), chitinase-3-like protein 1 (YKL-40) and monocyte chemoattractant protein-1 (MCP-1), are secreted by different glial cells and have been found to be increased in CSF of patients with ALS.3 15–17 Interestingly, multivariate models of inflammatory biomarkers in both blood and CSF have been associated with the prognosis in ALS.16 18 Prognostic markers in ALS, including the neurodegenerative marker neurofilament light chains (NfL), are currently gaining attention because they might be instrumental for patient stratification in clinical trials.19 Therefore, we evaluated if the inflammation markers CHIT1, YKL-40 and MCP-1 in CSF or blood correlated with the extent of motor neuron disease in patients with ALS. We further evaluated if these markers had an added value as prognostic markers in ALS. To do so, we performed a multivariate regression analysis, including eight other established prognostic factors, such as bulbar onset, age at onset, definite ALS following the revised El Escorial criteria, diagnostic delay, forced vital capacity (FVC), disease progression rate, frontotemporal dementia (FTD) and the presence of a C9orf72 repeat expansion.20
Methods
CSF was sampled through a lumbar puncture (LP) in patients referred to the neuromuscular reference centre (NMRC) of the University Hospitals Leuven. All patients had complaints of muscle weakness or speech/swallowing/breathing difficulties. Patients were enrolled between May 2014 and August 2017. Eventually, patients received the diagnosis of ALS (n=105) according to the revised El Escorial and Awaji criteria,21–23 or of a disease mimicking ALS (DM). The latter cohort included 16 patients with symptoms reminiscent of ALS at the time of LP but for whom ALS was ruled out on follow-up by an expert neurologist (PVD and KC).
The disease duration at sampling was defined as the time difference between estimated first symptom onset (including muscle weakness or speech/swallowing/breathing difficulties) and date of CSF sampling. The diagnostic delay was defined as the time between estimated clinical symptom onset and the diagnosis established by a neurologist at our NMRC. The disease progression rate was defined as the difference between the maximum ALSFRS-R and the ALSFRS-R score closest to the date of CSF sampling, divided by the disease duration at the date of ALSFRS-R score. Patients with ALS having a time difference between date of ALSFRS-R scoring and LP of more than 3 months were excluded from the correlation between CSF markers and the disease progression rate. Patients with a disease progression rate lower than 0.395 points/month, corresponding to the 25th percentile, were defined as slow progressors, patients with a disease progression rate between 0.395 and 1.364 points/month were defined as intermediate progressors, while patients with a disease progression rate higher than 1.364 points/month, corresponding to the 75th percentile, were defined as fast progressors. The extent of UMN degeneration was defined as the number of regions (bulbar, upper limb and lower limb regions) displaying UMN degeneration as clinically assessed according to the Awaji and revised El Escorial criteria. Thoracic UMN degeneration was not assessed routinely. The extent of LMN degeneration was defined as the number of regions (thoracic, bulbar, upper limb and lower limb regions) displaying LMN degeneration as assessed clinically and via electromyography (EMG) based on the Awaji criteria. Patients with ALS having a time difference of more than 3 months between motor neuron degeneration assessment and LP were excluded from the comparison between the CSF levels of the inflammation markers and the extent of motor neuron degeneration. The FVC was estimated with spirometry for 96 patients with ALS. Survival was defined as the timespan between LP and date of death.
Serum samples were available for 102 patients with ALS and for 16 DM. Patients with ALS having a timespan between LP and blood sampling of more than 3 months were excluded from the correlation between CSF and serum values. Similarly, patients with ALS with a time difference of more than 3 months between date of sampling and date of ALSFRS-R scoring or EMG were excluded from correlation analysis. Furthermore, we included 102 neurological disease controls (DC), having a diagnosis distinct from ALS or a DM, and who underwent LP and blood sampling for diagnostic purposes.
The CSF and serum levels of CHIT1 were assessed with a commercial enzyme-linked immunosorbent assay (ELISA) (cat#: CY-8074, CircuLex, distributed by MBL International, Woburn, Massachusetts, USA). The CSF and serum samples were diluted 1:20 and 1:50, respectively, in sample buffer. The limit of detection (LOD) of the assay was 48.3 pg/mL. The limit of quantification (LOQ) was 56.25 pg/mL. The CSF and serum levels of YKL-40 were assessed with an ELISA (cat # 8020, MicroVue, San Diego, California, USA; LOD: 5.4 ng/mL; LOQ: 15.6 ng/mL). The CSF samples were diluted in 1:3.5 in dilution buffer. The serum samples were loaded undiluted. The CSF levels of MCP-1 were assessed with a multiplex electrochemiluminescent assay (V-Plex Chemokine Panel 1 Human kit, cat # K15047D, MesoScale Discovery, Gaithersburg, Maryland, USA; LOD: 0.09 pg/mL; LOQ: 1.09 pg/mL). The other analytes measured with the multiplex were not reported as the levels in patients with ALS were not significantly different from controls (MIP-1β, IP-10 and IL-8) or were outside the detection range (eotaxin-3) (data not shown). The CSF levels of NfL and phosphorylated neurofilament heavy chain (pNfH) were available for 97 and 84 patients with ALS, respectively, and were assessed with an ELISA (cat # 10-7001, UmanDiagnostics, Umea, Sweden and EQ 6561-9601, Euroimmun, Lubeck, Germany, respectively) for which the values were the same as we reported before.24 25
Statistical analysis
Normality was assessed with the D’Agostino-Pearson’s test. Correlations were calculated by means of the two-tailed Spearman’s rank correlation with a Bonferroni correction for multiple testing at a significance level of 1%. Comparisons between the CSF levels of the inflammation markers or age at sampling in the different diagnostic groups (ALS, DM and DC) and comparisons between the CSF and serum levels of the inflammation markers in the different clinical subgroups (progression rate and extent of neurodegeneration subgroups) were performed with the Kruskal-Wallis’ test, corrected for multiple comparison with the Dunn’s post hoc test, at a significance level of 5%. Receiver operating characteristic (ROC) curves were generated to estimate the area under the curve (AUC) and optimal cut-offs were estimated via the highest Youden’s index. At optimal cut-offs, sensitivity, specificity, positive and negative likelihood ratios (+LR and –LR, respectively), and positive and negative predictive values (PPV and NPV, respectively) were defined to estimate the performances of the inflammation markers to discriminate between patients displaying a slow and fast disease progression, or between patients with ALS and DC or DM. For the comparison between slow and fast progressors, the predictive values were calculated based on the prevalence obtained by Gomeni and Fava.26 The effect of age and gender on the AUC was assessed with a logistic regression and an adjusted AUC was reported, based on the predictive probabilities, in the case of significant differences with the unadjusted AUC of the ROC curve. Prior to the logistic regression, CSF levels of the inflammation markers were log transformed to limit their non-normal distribution. Survival in the different subgroups was assessed with Kaplan-Meier curves and the log-rank test was utilised to assess the differences between the survival curves. The tertiles of the inflammatory markers were assessed using the univariate Cox proportional-hazards regression analysis. Based on a recent study of prognostic factors in ALS,20 the following parameters were added as survival covariables to the multivariate Cox regression for each inflammatory marker: tertile CSF levels of the inflammation marker, disease progression rate (points/month), number of regions with UMN and LMN degeneration, age at LP, FVC, definite ALS based on the revised El Escorial criteria, diagnostic delay, gender, C9orf72 status, FTD status and bulbar onset. The enter method was used for the univariate and multivariate Cox proportional-hazards regression analyses, meaning that all parameters were included in the model. An exclusion criterion for the Cox proportional-hazards regression was a time difference between the date of ALSFRS-R, EMG and FVC and the date of LP greater than 3 months. Graph and basic statistics were performed with GraphPad Prism (V.7.01, GraphPad Software, San Diego, California, USA), ROC curves, Kaplan-Meier, Logistic regression, comparison of ROC curves and Cox proportional-hazards regression were performed with MedCalc (V.17.9, MedCalc Software bvba, Ostend, Belgium).
Results
The demographics of patients with ALS, DM and DC are listed in table 1, and the subdivision of the DM and DC are presented in supplementary table S1. The ALS cohort was significantly older than the DC cohort (median age 63 vs 55, p=0.001).
Supplemental material
Demographics of patients with ALS, neurological disease controls and ALS disease mimics
The CSF levels of CHIT1, YKL-40 and MCP-1 were significantly higher in patients with ALS than in DC (figure 1A–C, table 1), although the rise was only weakly specific towards ALS (specificity ranging from 58.6% to 65.7%) (table 2). The CSF levels of CHIT1, YKL-40 and MCP-1 were higher in patients with ALS than in patients with a DM (figure 1A–C, table 1). With a +LR between 1.9 and 3.6, CHIT1, YKL-40 and MCP-1 are poor discriminatory markers between ALS and DM (figure 1D). Other performance characteristics are listed in table 2.
Performance characteristics of the CSF markers

Comparisons and receiver operating characteristics (ROC) curves of CSF levels of CHIT1, YKL-40 and MCP-1 between patients with ALS, neurological disease controls (DC) and ALS disease mimics (DM). Comparisons between CSF levels of CHIT1 (A), YKL-40 (B) and MCP-1 (C) in patients with ALS, DC and DM. ROC curves of the CSF levels of CHIT1, YKL-40 and MCP-1 to discriminate between patients with ALS from DC (solid black line: CHIT1; solid blue line: YKL-40; solid red line: MCP-1) and DM (dashed black line: CHIT1; dashed blue line: YKL-40; dashed red line: MCP-1). *P<0.05; **p<0.01; ***p<0.001; ****p<0.0001. ALS, amyotrophic lateral sclerosis; AUC, area under the curve; CHIT1, chitotriosidase-1; CSF, cerebrospinal fluid; MCP-1, monocyte chemoattractant protein-1; YKL-40, chitinase-3-like protein 1.
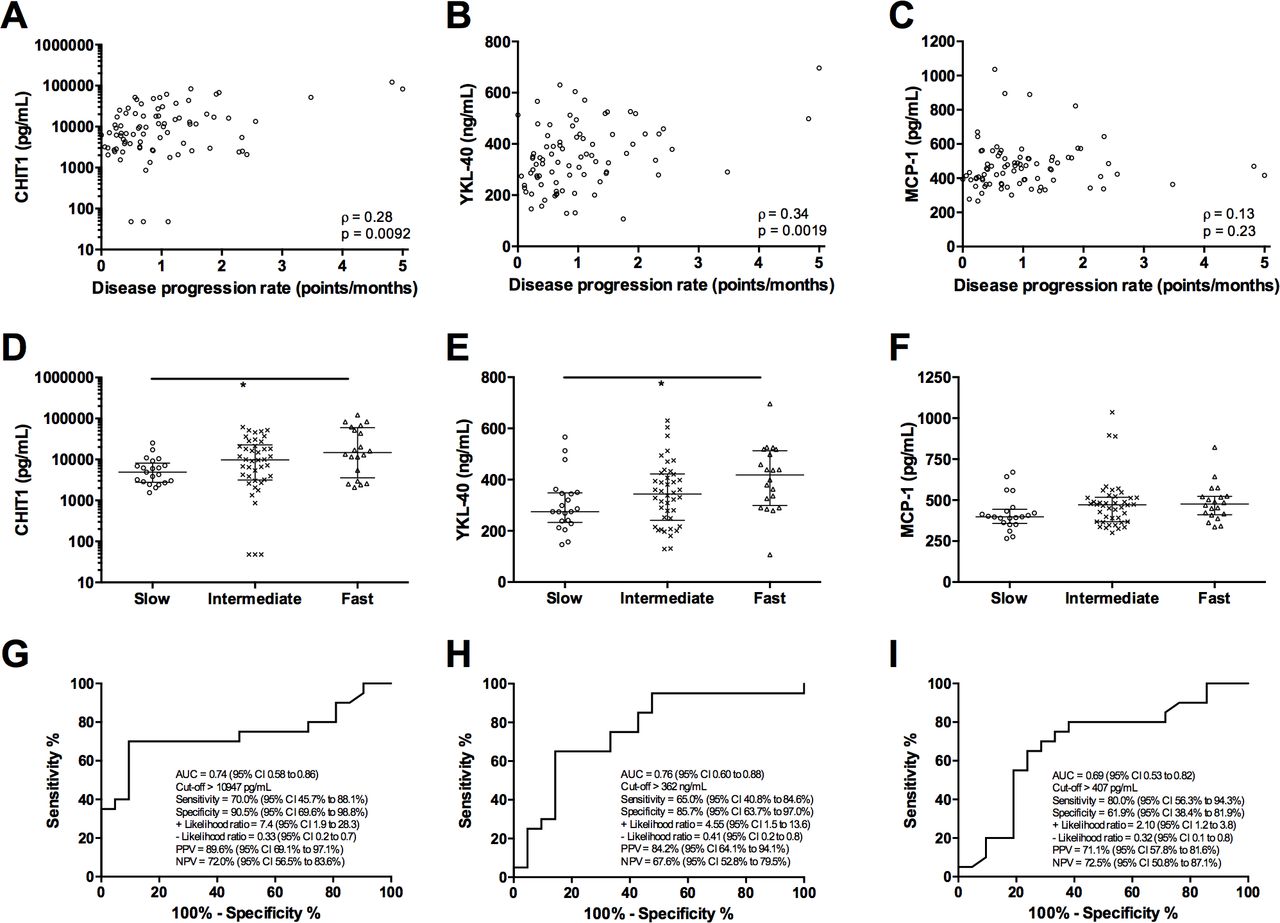
CSF levels of YKL-40, CHIT1 and MCP-1 correlated with each other, as well as with other markers in ALS, including NfL and pNfH (figure 2A–F, online supplementary figure 1). CSF levels of CHIT1, YKL-40 and MCP-1 did not correlate with the disease duration at LP (online supplementary figure 2A–C), but were significantly inversely correlated with survival after CSF sampling (figure 2G–I). Moreover, CSF levels of CHIT1 and YKL-40, but not MCP-1, weakly correlated with the disease progression rate at the time of LP (figure 3A–C).
Supplemental material
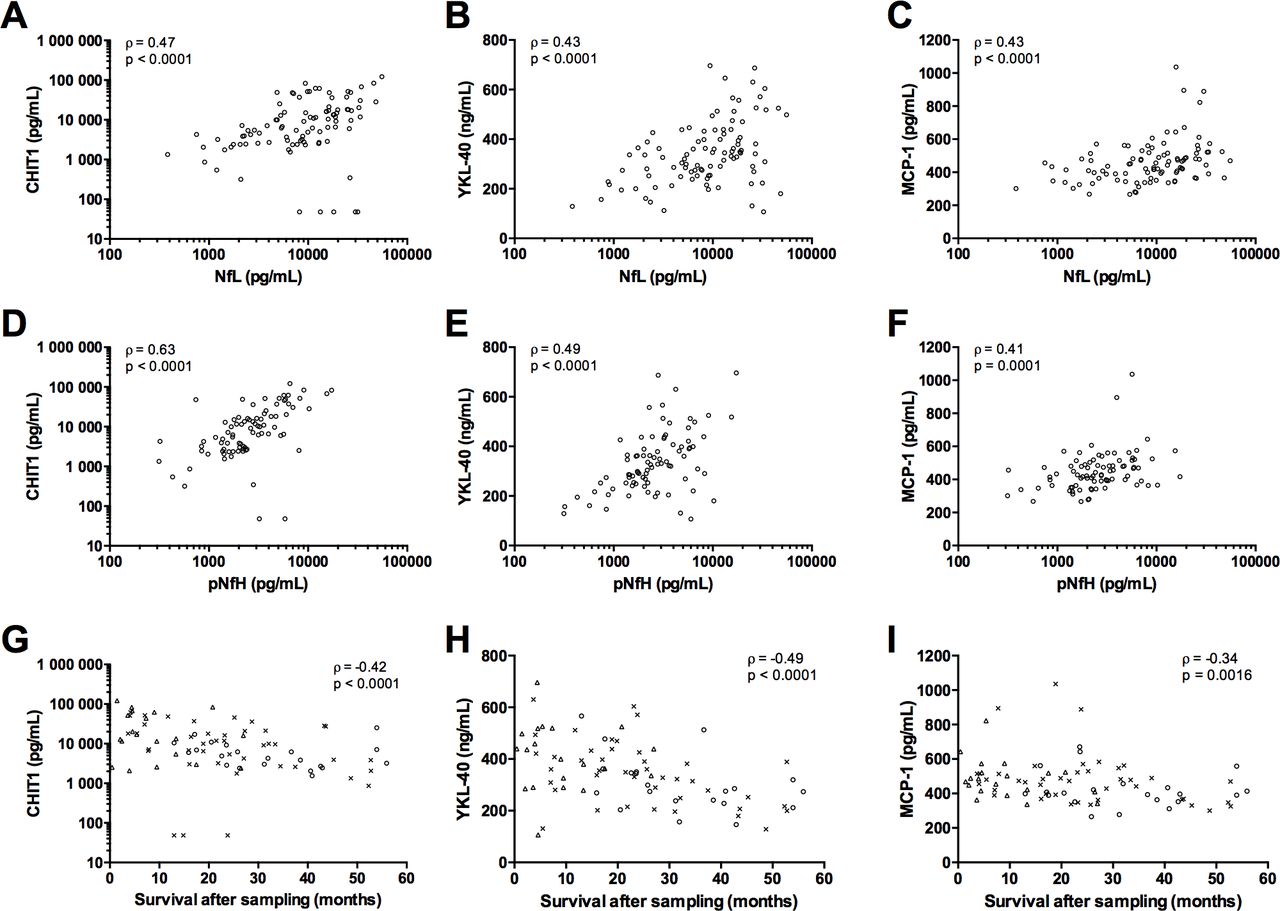
Correlation between the inflammatory markers, and with neurofilaments and survival from sampling. Correlation between CSF levels of NfL and CSF levels of CHIT1 (A), YKL-40 (B) and MCP-1 (C). Correlation between CSF levels of pNfH with CSF levels of CHIT1 (D), YKL-40 (E) and MCP-1 (F). Correlations between CSF levels of CHIT1 (G), YKL-40 (H) and MCP-1 (I) with survival after LP, in patients with ALS stratified for their disease progression rate (slow (circles), intermediate (crosses) and fast (triangles) progressors). The CSF levels NfL and pNfH are described in these references.24 25 ALS, amyotrophic lateral sclerosis; CHIT1, chitotriosidase-1; CSF, cerebrospinal fluid; LP, lumbar puncture; MCP-1, monocyte chemoattractant protein-1; NfL, neurofilament light chain; pNfH, phosphorylated neurofilament heavy chain; YKL-40, chitinase-3-like protein 1.

Correlations between CSF levels of the inflammatory markers and the disease progression rate. Correlations between CSF levels of CHIT1 (A), YKL-40 (B) and MCP-1 (C) with disease progression rate (points/month). CSF levels of CHIT1 (D), YKL-40 (E) and MCP-1 (F) are shown in slow (circles), intermediate (crosses) and fast (triangles) progressors. Receiver operating characteristics curve of CSF levels of CHIT1 (G), YKL-40 (H) and MCP-1 (I) to discriminate between patients with slow and fast disease progressions. The associated diagnostic performances are shown in the figure panels. *P<0.05. AUC, area under the curve; CHIT1, chitotriosidase-1; CSF, cerebrospinal fluid; MCP-1, monocyte chemoattractant protein-1; NPV, negative predictive value; PPV, positive predictive value; YKL-40, chitinase-3-like protein 1.
CSF levels of CHIT1 correlated with the number of regions affected by both UMN and LMN degeneration (median CSF CHIT1 levels; one region vs three regions: 4248 vs 13 518 pg/mL, p=0.0075; figure 4A). CSF levels of YKL-40 and MCP-1 tended to increase, but not significantly, with the number of regions exhibiting UMN and LMN degeneration (one region vs three regions: 295 vs 362 ng/mL; one region vs three regions: 403 vs 481 pg/mL, respectively; figure 4B–C). The CSF levels of CHIT1 tended to increase with the number of regions exhibiting UMN or LMN degeneration, whereas the CSF levels of YKL-40 and MCP-1 remained stable (online supplementary figure 3).

Correlations between CSF levels of CHIT1, YKL-40 and MCP-1 with the extent of motor neuron degeneration. Correlations between CSF levels of CHIT1, YKL-40 and MCP-1 with the number of regions exhibiting both UMN and LMN degeneration (A, B and C, respectively). **P<0.01. CHIT1, chitotriosidase-1; CSF, cerebrospinal fluid; LMN, lower motor neurons; MCP-1, monocyte chemoattractant protein-1; UMN, upper motor neurons; YKL-40, chitinase-3-like protein 1.
Inflammatory markers as predictors of progression rate and survival in ALS
Patients with ALS displaying a faster disease progression rate exhibited higher CSF levels of CHIT1 and YKL-40, but not of MCP-1, as compared with slow progressors (figure 3D–F, Table S2). Based on an ROC curve analysis, the CSF levels of CHIT1 fairly discriminated between slow and fast progressors, given a +LR of 7.4 (95% CI 1.9 to 8.3) (figure 3G), whereas the CSF levels of YKL-40 and MCP-1 rather weakly discriminated between slow and fast progressors, given a +LR of 4.55 (95% CI 1.5 to 13.6) and 2.10 (95% CI 1.2 to 3.8), respectively (figure 3H–I).
Based on Kaplan-Meier survival curves, survival of patients based on the different tertiles of CSF levels of CHIT1, YKL-40 or MCP-1 were significantly different (log-rank test: χ²=10.80, p=0.0045; χ²=24.26, p<0.0001; χ²=9.56, p=0.0084, respectively; figure 5A–C). The CSF levels of CHIT1, YKL-40 and MCP-1 were identified as significant predictors of the mortality rate based on univariate Cox regressions (table 3).
Univariate and multivariate Cox proportional-hazards regression

Survival curves of the different inflammatory markers. CSF levels of CHIT1, YKL-40 and MCP-1 were stratified in low, mid and high tertiles. Kaplan-Meier curves were created for CHIT1 (A), YKL-40 (B) and MCP-1 (C). The disease progression rate, number of regions displaying both UMN and LMN degeneration, age at LP, definite ALS according to the revised El Escorial, gender, FTD status, C9orf72 status, bulbar onset, diagnostic delay and forced vital capacity were entered together with the CSF levels of CHIT1 (D) or YKL-40 (E) or MCP-1(F) in multivariate Cox regression models. CHIT1, chitotriosidase-1; CSF, cerebrospinal fluid; MCP-1, monocyte chemoattractant protein-1; YKL-40, chitinase-3-like protein 1.
A multivariate Cox regression, including CSF levels of either CHIT1, YKL-40 or MCP-1, and the disease progression rate, number of regions displaying UMN and LMN degeneration, diagnostic delay, age at LP, FVC, definite ALS based on the revised El Escorial criteria, bulbar onset, gender, FTD status and C9orf72 status revealed that YKL-40 and MCP-1, but not CHIT1, were independent predictors of survival (figure 5D–F, table 3). The FVC was an independent predictor of survival in each multivariate Cox regression, including either CHIT1, YKL-40 or MCP-1 (Table S3). Moreover, the diagnostic delay and the disease progression rate were independent variables in the multivariate Cox regression of YKL-40 and MCP-1, respectively (Table S3).
Serum CHIT1 and YKL-40
The CSF and serum levels of CHIT1 and YKL-40 correlated weakly (online supplementary figure 4A,B). The serum levels of CHIT1 and YKL-40 were not statistically different between patients with ALS and DM (online supplementary figure 4C,D). The serum levels of YKL-40, but not those of CHIT1, tend to increase with a faster disease progression rate (online supplementary figure 5A,B). The serum levels of CHIT1 and YKL-40 were unchanged with increased motor neuron degeneration defined as the number of regions displaying UMN and LMN degeneration (online supplementary figure 5C,D).
Discussion
In this study, we showed that CSF levels of CHIT1, YKL-40 and MCP-1 are increased, although not specifically, in patients with ALS as compared with DC. The discriminative performance of the inflammatory markers in CSF between ALS and DM is rather poor in terms of likelihood ratios, conform to a prior study.3 Also, the sensitivity and specificity for CHIT1 levels in CSF differed from previously reported results (82% vs 67%, and 51% vs 81%, respectively).3 In the current study, CSF was prospectively sampled at the time of diagnosis with a median disease duration of 11 months. Steinacker et al included ALS patients with a slow or a fast disease progression rate, with a median disease duration of 48 months.3 However, the difference in disease duration might not explain the herein observed contrast in reported sensitivities and specificities as Thompson et al reported that CHIT1 levels remained stable in longitudinal measurements of patients with ALS.16 Moreover, our findings also suggest that CHIT1 levels in CSF remained constant as a function of the disease duration. Another important observation that might confound our findings was the recent discovery of the CHIT1 polymorphism in patients with ALS.27 This polymorphism reduced the CHIT1 levels in CSF of patients with ALS.
Next, we now showed that YKL-40 levels in CSF have rather poor diagnostic performance between ALS and DM. These findings are opposed to a previously reported AUC of 0.90.15 16 Estimated disease duration was about 31 months in the latter study, which might, together with the findings of increasing YKL-40 levels in CSF over time,15 16 explain the differences with the current study. In line with previous findings, CSF levels of MCP-1 were higher in patients with ALS as compared with DM and DC. We now showed that MCP-1 has only limited diagnostic performances. Altogether, the diagnostic performances of the aforementioned inflammatory markers were worse than previously studied biomarkers for ALS, such as NfL and pNfH.24 25 28
MCP-1 has been incorporated in a multivariable model to predict survival in ALS, including other inflammation-related proteins in blood or CSF, such as IL-8 and IP-10.18 However, routine multivariable modelling is complex with respect to measurements (eg, to handle the effect of analytical variability of all individual components in the complex multivariable equation) and with respect to interpretation (eg, commutability of data among centres and establishing a general cut-off). We now assessed the individual prognostic value of each inflammatory marker to predict survival by means of predefined cut-offs corresponding to tertile values of the respective biomarker. CHIT1 and YKL-40 have been subject of a previous study evaluating prognostic markers for ALS. Only CSF levels of CHIT1 were significantly associated with a shorter survival.16 However, this was achieved via mass spectrometric analysis yielding relative protein abundancies, which are less suitable for use in routine clinical practice. In contrast, we now measured quantifiable protein levels of CHIT-1 and YKL-40 using commercially available immunoassays.
Our findings now add YKL-40 and MCP-1 to the available prognostic markers for survival in ALS, with fixed cut-offs, and irrespective of other established markers, including bulbar onset, age at onset, definite ALS, diagnostic delay, FVC, progression rate, frontotemporal dementia and presence of a C9orf72 repeat expansion, all recently entered in a personalised prediction model for survival in ALS.23 Thompson et al reported that CHIT1, although as a continuous variable, was the only inflammation marker to be prognostic in a Cox proportional hazards model, including age at onset, onset site and gender.18
Our study has several shortcomings: (i) the sample size of the DM was rather small, but reflected the relative prevalence of disease mimics towards the number of patients with ALS seen at the NMRC of the University Hospitals Leuven. (ii) The survival was not complete so it was not possible to calculate the median survival of the slow progressors. (iii) We restricted the multivariate survival analysis to the individuals with complete data set and used objective exclusion criteria to exclude potential bias due to delay between sampling and clinical assessment. However, applying such stringent exclusion criteria limited our sample size, which could be a source of bias. (iv) We did not control for comorbidities that could have a significant influence on the levels of inflammatory markers and on their ability to predict survival unrelated to ALS.
Altogether, our findings warrant larger multicentre studies on inflammatory markers in ALS to better estimate the effect of inflammation on survival. Further studies, especially longitudinal studies, are needed to investigate the dynamics of surrogate markers of gliosis as a function of the disease stages. Also, it remains an open question why these inflammatory markers behave differently, more research has to be performed on the origin of these inflammatory markers and the activation of the different glial cells during the disease duration in patients with ALS.
References
Footnotes
BG and MDS are shared first authorship.
PVD and KP are shared last authorship.
Contributors Concept and design: BG, MDS, PVD, KP and JT. Drafting of the manuscript and figures: BG, MDS, KP and LD. Acquisition, analysis or interpretation of data: BG, MDS, LD, JG, KC, LVDB, JT, PVD and KP. Critical revision of the manuscript for important intellectual content: all authors.
Funding The work was supported by the agency Flanders Innovation & Entrepreneurship, Opening the Future Fund (KU Leuven), the Interuniversity Attraction Poles programme P7/16 of the Belgian Federal Science Policy Office, the Flemish Government initiated Flanders Impulse Programme on Networks for Dementia Research, the European Union Joint Programme-Neurodegenerative Disease Research project STRENGTH and RiMod-FTD, the European E-Rare-2 project PYRAMID. MDS has a PhD Fellowship of the Research Foundation—Flanders (11E6319N) and a grant of the Rotary’s ‘Espoir en Tête—Hoofd zaak er is Hoop’. LD is funded by a PhD Fellowship of the Research Foundation—Flanders (FWO-Vlaanderen) (1165119N). PVD holds a senior clinical investigatorship of FWO-Vlaanderen and is supported by the ALS Liga Belgium and the KU Leuven ALS fund ‘Een hart voor ALS’ and ‘Laeversfonds voor ALS onderzoek’.
Competing interests None declared.
Patient consent for publication Obtained.
Ethics approval The study was approved by the Ethical Committee of the University Hospitals of Leuven.
Provenance and peer review Not commissioned; externally peer reviewed.
Data availability statement Data are available on reasonable request.
Linked Articles
- Editorial commentary