


Abstract
A pharmacokinetic/pharmacodynamic (PK/PD) model was developed to simultaneously characterize interferon after i.v. and s.c. dosing at various dose levels. A sequential study in monkeys (n = 18) was conducted, where single doses of 1, 3, and 10 MIU/kg of recombinant-human interferon-β (IFN-β) 1a were given i.v. and then s.c. Plasma concentrations of IFN-β were determined and biphasic neopterin concentrations were used as the pharmacodynamic (PD) endpoint. Multiple dosing also was evaluated by giving 1 MIU/kg s.c. doses once daily for 7 days (n = 3). The integrated model uses target-mediated drug disposition to describe drug elimination by receptor binding and internalization, and well characterizes the observed nonlinear pharmacokinetic (PK) profiles. The s.c. doses exhibited an absorption phase (Tmax = 3 h) and incomplete bioavailability (F = 0.3–0.7). An indirect response model for stimulation of neopterin triphosphate production by activated receptor complex followed by conversion to neopterin was used to jointly model the formation and loss of neopterin with a capacity factor Smax = 23.8. Greater relative neopterin response after s.c. dosing was accounted for by prolonged receptor activation relative to the SC50 value. Repeated daily s.c. dosing produced modestly elevated IFN-β1a concentrations and neopterin concentrations that were lower than simulated from single-dose modeling. Although several mechanisms could be involved, these phenomena were simply remodeled as down-regulation of Smax and receptors. The PK/PD model for IFN-β1a depicts receptor binding as a key feature controlling nonlinear elimination, nonstationary kinetics, and neopterin induction in a manner consistent with known processes controlling its disposition and pharmacological effects.
The interferons (IFNs) represent a family of endogenous proteins that exhibit antiviral, antiproliferative, and immunomodulatory effects (Pestka et al., 1987; Leonard, 1999). These compounds are being investigated for a variety of clinical indications. IFN-β, in particular, has shown dose-dependent efficacy in several clinical trials and is being used for treatment of multiple sclerosis (for review, see Goodin et al., 2002). The mechanism of action for this indication is still unclear and is likely that the activity is due to a combination of some of the biological activities of IFN-β (Yong et al., 1998), including antiviral activity, changes in cell distribution, activation of cytotoxic activities of lymphocytes, macrophages, and natural killer cells, regulation of cytokine and cytokine receptor gene expression, and an increase in expression of some tumor-associated antigens (Pestka et al., 1987; Leonard, 1999).
Limited analyses of the pharmacokinetics/pharmacodynamics (PK/PD) of IFN-β have been reported. In general, plasma concentrations of IFN-β decline rapidly in a biexponential manner after i.v. administration, with a terminal half-life of approximately 5 h in humans (Wills, 1990; Chiang et al., 1993; Salmon et al., 1996). After s.c. or i.m. dosing, incomplete and prolonged absorption yields significantly lower plasma concentrations relative to i.v. administration, which remain detectable for longer periods of time (Gloff and Wills, 1992; Chiang et al., 1993; Salmon et al., 1996; Alam et al., 1997; Munafo et al., 1998). Animal studies suggest that IFN-β distributes into a volume consistent with total body water and that uptake into specific organs and tissues is negligible (Gloff and Wills, 1992). A primary mechanism of elimination of IFN-β may be receptor-mediated endocytosis (Pestka et al., 1987), which suggests a strong component of target-mediated drug disposition (Levy, 1994). Other elimination pathways include liver and kidney catabolism and proteolytic degradation (Wills, 1990; Gloff and Wills, 1992). Most PK/PD studies have been limited by noncompartmental approaches (Alam et al., 1997; Munafo et al., 1998; Williams and Witt, 1998) and use of single-dose levels (Chiang et al., 1993; Salmon et al., 1996).
Various pharmacological effects caused by IFN-β have been assessed. Adverse reactions such as those associated with a flu-like syndrome show a slow onset and dissipation, and there were suggestions that IFN-β1a may be better tolerated than IFN-β1b (Buraglio et al., 1999). A number of biomarkers, including plasma neopterin and β2-microglobulin concentrations, intracellular 2′,5′-oligodenylate synthetase activity as well as peripheral blood mononuclear cell cytokine secretion have been used to assess the effects of IFN-β in vivo (Chiang et al., 1993; Alam et al., 1997; Munafo et al., 1998; Rothuizen et al., 1999). It was shown recently that IFN-β-induced immunomodulation in vivo strongly depends on the administration schedule, with the effect being 2 to 3 times greater when the same weekly dose is divided into three injections in healthy volunteers (Rothuizen et al., 1999). Plasma neopterin, as a biomarker for IFN-β effects, displays similar behavior in humans (Chiang et al., 1993; Alam et al., 1997; Munafo et al., 1998) as well as in monkeys (this study). Neopterin is thus a useful pharmacological marker for receptor/gene-mediated effects of IFN-β and allows determination of the role of dose, route of administration, and chronic dosing in the dynamics of natural and modified forms of IFN-β.
The purpose of this report is to characterize IFN-β1a disposition over a range of doses in monkeys, including absorption kinetics and bioavailability after similar i.v. and s.c. doses, kinetics after multiple daily s.c. dosing, and the inductive effects of these treatments on neopterin concentrations. A comprehensive and mechanistic PK/PD model based on receptor-mediated disposition as well as activated IFN-β1a-receptor complex-mediated stimulation of neopterin formation was developed to quantitate these experimental data.
Materials and Methods
Animals. Eighteen (nine males and nine females) Macaca fascicularis (cynomolgus) monkeys were used in this study. The average weight of the male animals at the time of i.v. administration was 3.08 kg (range 2.58–3.65 kg) and 3.20 kg (range 2.64–3.93 kg) at the time of s.c. administration. The corresponding average weights of the female animals were 2.77 kg (range 2.66–2.96) and 2.80 kg (range 2.77–2.93). The animals were clearly identified, received a standardized diet during the acclimatization period, and were in good health at the time of the study.
Experimental Procedures. The in vivo part of the study was conducted in two phases. In the first phase, three study groups, each of six monkeys (three male and three female) received separate doses of 1, 3, or 10 MIU/kg of recombinant-human IFN-β1a given sequentially as an i.v. and then s.c. bolus injection (0.3 ml/kg). After i.v. bolus administration, plasma concentrations of IFN-β1a were determined at 0, 0.083, 0.25, 0.5, 1, 3, 6, 9, 12, 24, and 48 h. Plasma concentrations of neopterin were determined at 0, 3, 6, 12, 24, 48, 72, and 96 h postdose. After a 1-week washout period, plasma concentrations of IFN-β1a were determined at 0, 0.5, 1, 3, 6, 9, 12, 24, 48, 72, and 96 h after the s.c. administration of the dose. Neopterin plasma concentrations after s.c. dosing were determined at scheduled times similar to those used after i.v. dosing.
In the second phase of the study, the three male monkeys that received the 1 MIU/kg single dose were used in a repeated s.c. administration study. These monkeys received 1 MIU/kg IFN-β1a s.c. once daily for 7 days. Plasma concentrations were determined at 0, 0.5, 1, 3, 6, 9, and 12 h after the first dose, predose on days 2 through 7, and at 0.5, 1, 3, 6, 9, 12, 24, 48, 72, 96, and 120 h after the last dose on day 7. Neopterin plasma concentrations were determined at 0, 3, 6, and 12 h after the first dose, predose on days 2 through 7, and at 3, 6, 12, 24, 48, 72, 96, and 120 h after the last dose on day 7.
Drug Assay. IFN-β1a was measured in plasma using a commercially available human IFN-β enzyme-linked immunosorbent assay kit (Toray Industries, Tokyo, Japan), previously validated for monkey plasma. The quantification limit of the method was 5 IU/ml.
Neopterin Assay. Neopterin was measured in plasma using a commercially available radioimmunoassay kit (ICN Biomedicals, Costa Mesa, CA), previously validated for monkey plasma. The quantification limit of the method was 1 ng/ml.
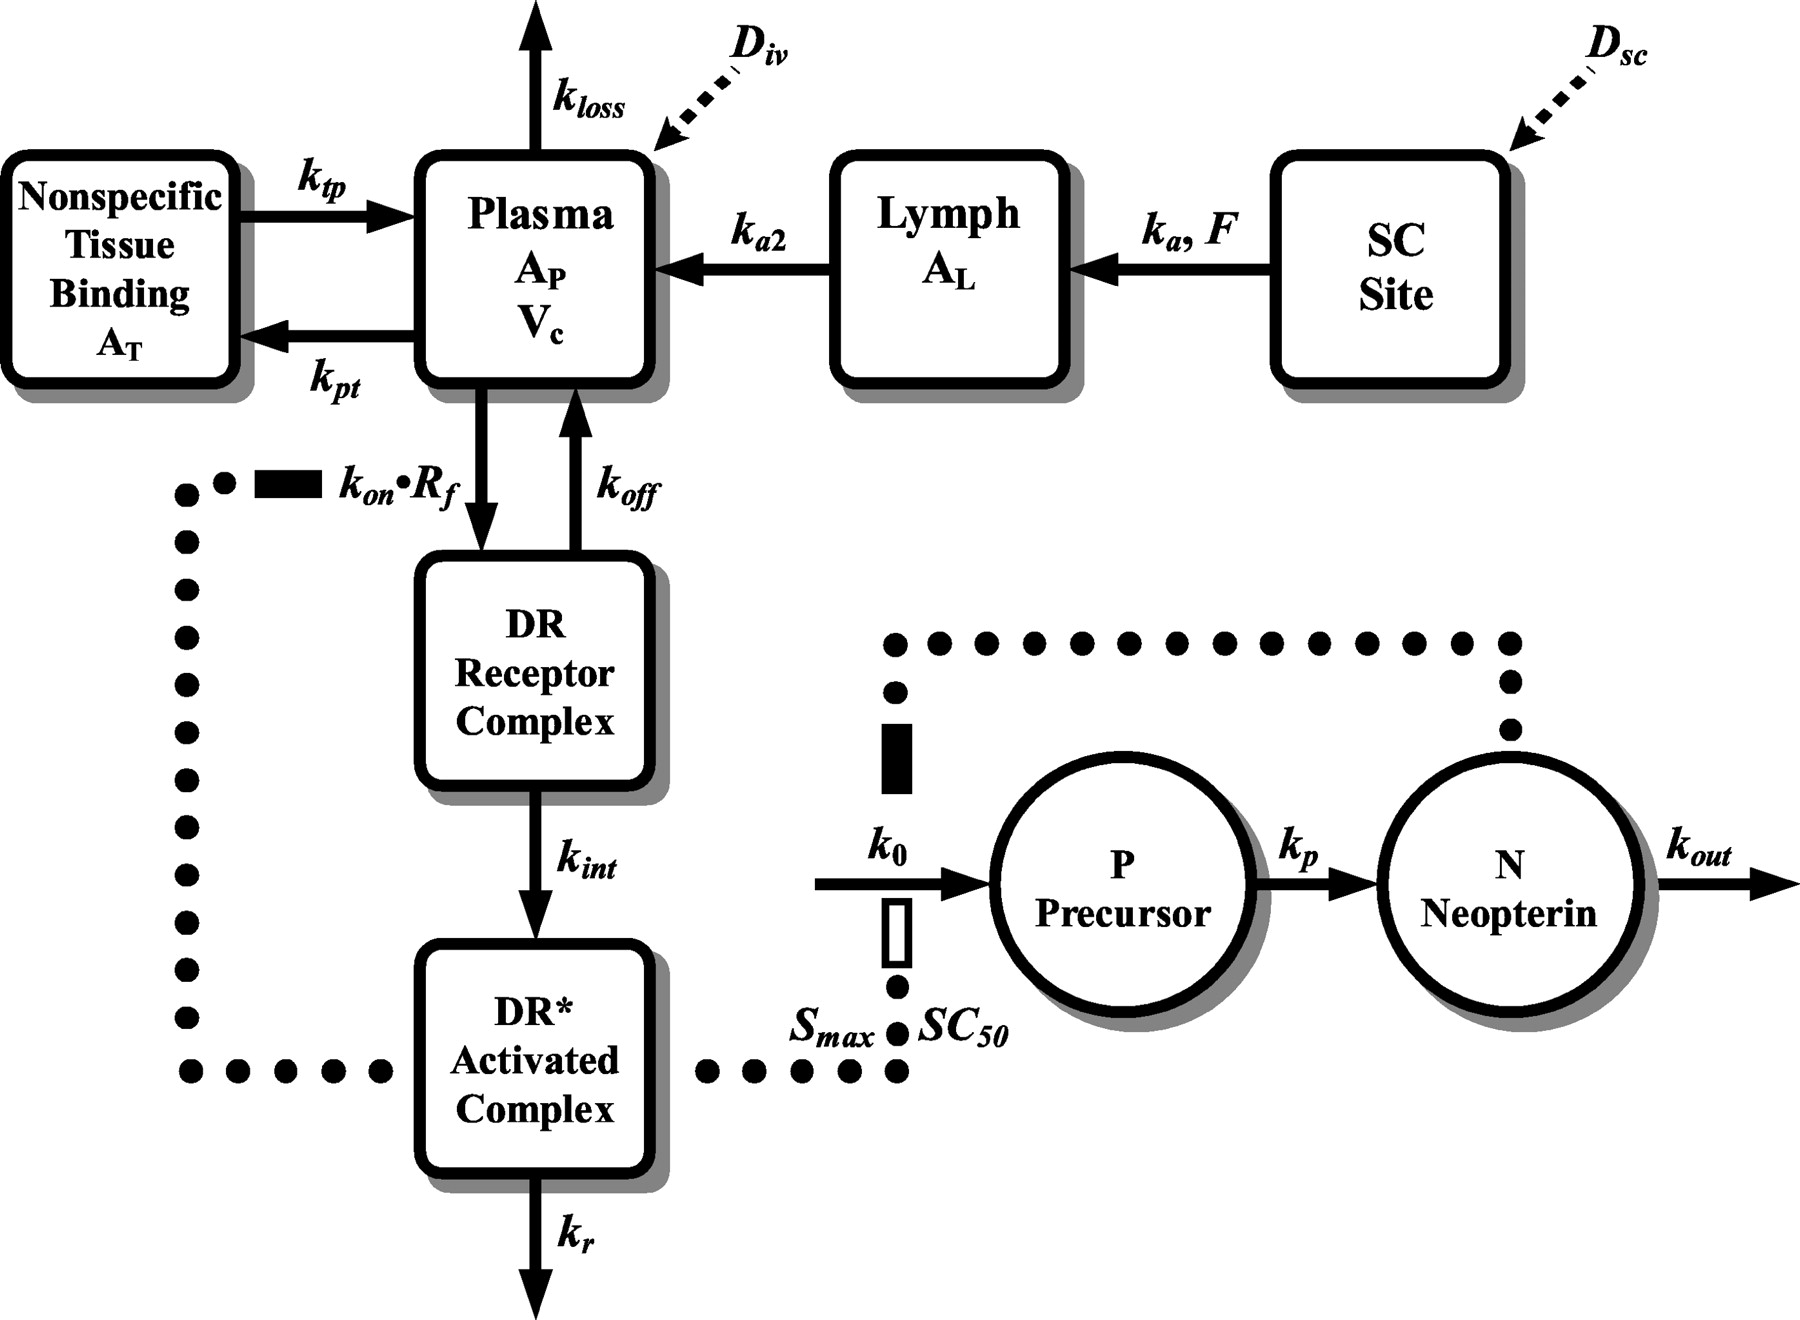
Pharmacokinetic/Pharmacodynamic Model. A preliminary noncompartmental analysis (Jusko, 1992) of individual IFN-β1a i.v. and s.c. data were conducted, revealing several aspects of the nonlinear disposition of the drug. A fully integrated PK/PD model based upon known or suspected mechanisms of action and biodistribution was proposed and is shown in Fig. 1. The nonlinear pharmacokinetic behavior of IFN-β1a was assumed to be primarily the result of its high-affinity binding to its pharmacological receptor site. Studies designed to characterize the binding of type I IFN to the IFN-α/β receptor have shown that cellular binding is both concentration- and time-dependent (Pestka et al., 1987). Furthermore, binding is saturable, being characterized by about 200 to 6000 receptors/cell, with dissociation constants of 10–9 to 10–11 M (Pestka et al., 1987). Cellular binding at 37°C results in rapid internalization by receptor-mediated endocytosis. Once internalized, IFN degradation products are formed and secreted by lysosomal metabolism (Pestka et al., 1987). This process was modeled as reversible kon and koff binding with a maximum receptor quantity of Rmax. The free (Rf) and bound drug-receptor complex (DR) are both reflected in the model. It follows that the primary mechanism of elimination of IFN-β1a is mediated by a saturable interaction with its biological receptor and subsequent internalization (receptor mediated endocytosis) and metabolism (lysosomal digestion) reflected as kint. Therefore, a simple drug-receptor binding process was used to describe the major elimination pathway of IFN-β1a from the central compartment (AP, Vc), whereas a tissue compartment (AT) with linear first-order distribution processes (kpt and ktp) was used to account for nonspecific drug binding. Other mechanisms of drug elimination, such as proteolytic degradation and renal elimination, were also included via a secondary pathway of elimination (kloss) from the central compartment.

Final integrated PK/PD model for characterizing the time course of IFN-β1a and neopterin plasma concentrations after i.v. and s.c. dosing of three dose levels in monkeys. Drug in central compartment (AP, Vc) binds (kon) to free cell-surface receptors (Rf) to form drug-receptor complex (DR), which either dissociates (koff) or is internalized (kint). Nonspecific binding (AT, kpt, ktp) and additional drug elimination pathways (kloss) are included. Drug in the s.c. site is absorbed (ka) into the lymphatics (AL) before transfer (ka2) to the central compartment. Separate bioavailability parameters (Fi) are used to assess dose-dependent effects on absorption. Internalized drug-receptor complex (DR*) stimulates (dotted line connected to open rectangle) the zero-order production (k0) of the precursor (P). Precursor is converted (kp) to neopterin (N), which is subsequently eliminated (kout). Down-regulation of Rmax and negative feedback inhibition of neopterin synthesis is also included in the diagram (dotted lines connected to solid rectangles).
The s.c. absorption of IFN-β1a was modeled in a similar manner as described by Radwanski et al. (1998). Because IFN-β1a is a relatively large molecule (mol. wt. ∼20,000), much of the drug should be transported through the lymphatic circulation (Supersaxo et al., 1990). Large molecular weight compounds administered by the s.c. route are thought to be absorbed into a lymphatic compartment before delivery into the systemic circulation. This was modeled as a linear first-order process (ka). The drug then enters the systemic circulation from the lymphatic compartment by a separate linear first-order rate process (ka2). Incomplete absorption occurred which was included as separate bioavailability fractions (Fi) for each dose.
In a preliminary compartmental analysis, the PK component of the model (Fig. 1) was fitted to mean plasma drug concentration profiles, resulting from all single i.v. and s.c. doses. The model was defined by the following differential equations: 


 where ad represents the administration method (i.v. or s.c.) and the symbols are defined in the abbreviations list. The amounts in the above-mentioned equations have units of nanomoles per kilogram, thus plasma drug concentrations were estimated as AP,ad/Vc · cf, where cf is a conversion factor (using specific activity = 3.8 × 10⁸ IU/mg). The initial conditions were all fixed to zero except for eq. 1 where AP,iv (0) = Doseiv. The initial parameter values were either taken from literature (e.g., Vc) or mathematically estimated (e.g., ka by the area function method; Cheng et al., 1988). The estimated parameters obtained from the simultaneous fitting of the three i.v. and s.c. doses included kpt, ktp, koff, kon, kint, Vc, Rmax, ka, ka2, kloss, F1, F2, and F3. These values were subsequently used as initial parameter estimates in an integrated PK/PD analysis.
In a similar manner, a preliminary compartmental analysis was also conducted for the pharmacodynamic data. The biosynthetic pathway of neopterin, the pharmacodynamic endpoint, is shown in Fig. 2. Interferons are thought to stimulate the production of neopterin via the induction of GTP-cyclohydrolase I (Fuchs et al., 1992). Once formed, there is no metabolism of neopterin, and its biological half-life depends primarily on renal clearance (Fuchs et al., 1992). Thus, based upon the mechanisms by which neopterin is produced and its biological disposition, a modified precursor-dependent indirect response model (Sharma et al., 1998) was proposed to describe the time course of plasma neopterin concentrations after dosing of IFN-β1a. The modification involves the use of the indirect response model III (Dayneka et al., 1993), driven by the amount of internalized drug-receptor complex (DR*), to stimulate the apparent zero-order production (k0) of the precursor (P) species (neopterin triphosphate) responsible for the production of neopterin (N). The pharmacodynamic component of the model is also shown in Fig. 1, and the differential equation used to describe the rate of change of the internalized drug-receptor complex over time was as follows:  where DR and kint are governed by the pharmacokinetics and the loss of DR* (kr) by the dynamics. The initial conditions of DR* were set to zero. No attempt was made to incorporate the recycling of internalized receptors, because literature suggests that internalized receptors are not recycled to the cell surface (Zoon and Arnheiter, 1984). The time course of DR* was used to stimulate precursor production and was described as follows:
  where formation of precursor is assumed to be a zero-order rate process (ko). Stimulation occurs by capacity (Smax) and sensitivity (SC50) constants controlled by DR* and conversion to neopterin (N)is first-order (kp). Finally, the rate of change of the response variable over time can be defined as follows:
  with first-order loss (kout) of the response variable. A steady-state baseline was assumed, where the response variable begins at an initial concentration (N0), changes with time after drug administration, and eventually returns to that baseline value. Therefore, the zero-order production rate constant can be defined as follows:
  thereby reducing the number of parameters to be estimated. Because an apparent dose-dependent increase in the time-zero concentrations of neopterin for the s.c. data were observed (presumably due to an insufficient washout period), N0 was set as the mean time-zero neopterin concentration from i.v. data (2.69 ng/ml). However, the initial conditions for eq. 9 for s.c. doses were set to model predicted concentrations at 168 h (1 week) after i.v. dosing (precursor concentrations were predicted to have returned to baseline values). The initial concentration of precursor (P0) can be secondarily determined from the rate constants k0 and kp (Sharma et al., 1998):
  Initial parameter values also were estimated as described previously (Dayneka et al., 1993; Sharma et al., 1998). The estimated parameters obtained from the simultaneous PD fitting included Smax, SC50, kout, kp, and kr. Again, these values were used as initial parameter estimates in the final integrated PK/PD model fitting.

Neopterin biosynthetic pathway (adapted from Fuchs et al., 1992).
Once the preliminary analyses were completed, the entire PK/PD model (Fig. 1) was fitted simultaneously to all single-dose pharmacokinetic and pharmacodynamic data sets (mean data). The previous equations (eqs. 1–11) were used to define the model and details of methods of data analysis are described below.
Multiple Daily Dosing. The pharmacokinetic profile of IFN-β1a after multiple dosing (daily) was evaluated using two separate techniques. First, a simulation was conducted using the pharmacokinetic component of the model with all parameters fixed to those values reported in the results section. A second analysis was conducted with a submodel that allowed for the down-regulation of the maximum receptor density (Rmax). Receptor “down-regulation” has been shown to occur and can be induced by relatively low ligand concentrations (Pestka et al., 1987). This process was thought to result from a prolonged exposure to the internalized drug-receptor complex and was incorporated into the PK/PD model as an indirect response (Dayneka et al., 1993). Receptor production (ksyn,Rmax) and loss (kdeg,Rmax) were included, with the former affected by the quantity of DR* according to the following:  where the initial condition (Rmax0) was set to the value of Rmax estimated from the fitting of the model to the single-dose i.v. and s.c. data (Table 2). Again, stationarity was assumed, allowing the zero-order production of Rmax (ksyn,Rmax) to be defined as follows:
  All model parameters were fixed as previously described except for IC50,Rmax and kdeg,Rmax, which were estimated by fitting.
Estimated pharmacokinetic and pharmacodynamic parameters
Two similar approaches were used to characterize the pharmacodynamic profile after the s.c. daily dosing of IFN-β1a. First, a simulation was conducted using the final PK/PD model, with the most appropriate PK/PD model as the driving function, i.e., inclusion of receptor down-regulation. The second approach involves the concept of negative feedback inhibition. Literature suggests that prolonged elevation of neopterin concentrations may negatively impact on the ability of IFN-β1a to induce neopterin synthesis (Liberati et al., 1988). This effect may manifest itself as a lower Smax value upon repeated drug administration. Thus, the second approach uses the original PK/PD model (with receptor down-regulation) modified to account for negative feedback inhibition by using a direct inhibition model, driven by neopterin concentrations, to inhibit the ability of IFN-β1a to induce the precursor species. The equation used in the submodel was as follows:  where the initial Smax (Smax0) is the value estimated from the fitting of the model to the single-dose i.v. and s.c. data (Table 2), IC50,Smax is the neopterin concentration responsible for 50% inhibition of Smax, and τ is the time delay required for elevated neopterin concentrations to affect Smax. All model parameters were fixed as previously described except for IC50,Smax and τ, which were estimated.
Data Analysis. All parameters were estimated using nonlinear regression analysis with the ADAPT II computer program (D'Argenio and Schumitzky, 1997) by the maximum likelihood method (equations identified in previous sections). The variance model was defined as follows:  where VAR is the variance of the ith data point, σ1 and σ2 are the variance parameters (σ2 = 2), and M(θ,ti) is the ith predicted value from the PK/PD and multiple-dosing models. Separate variance parameters were used for PK and PD measures. The goodness-of-fit was assessed by the convergence of the regression analysis, Akaike Information Criterion, Schwartz Criterion, estimator criterion value for the maximum likelihood method in ADAPT II, correlation coefficients (R2), examination of residuals, and visual inspection.
Results
Pharmacokinetics. The mean plasma concentration-time profiles of IFN-β1a after i.v. and s.c. administration of three doses are shown in Fig. 3. A conventional noncompartmental analysis revealed a strong component of nonlinear disposition (Table 1) with dose-related decreases in apparent CL and Vss. The intravenous profiles seem characteristic of polyexponential models, with a rapid distribution phase, followed by a prolonged elimination phase. In contrast, the subcutaneous profiles reveal a simple biphasic pattern, with plasma concentrations detectable well after 24 h.

Pharmacokinetic profiles of IFN-β1a after simultaneously fitting the final PK/PD model to the mean data of three single i.v. (top) and s.c. (bottom) doses of 1 MIU/kg (•), 3 MIU/kg (□), and 10 MIU/kg (▴). Error bars represent standard deviations.
Noncompartmental analysis of individual IFN-β1a profiles in monkeysa
The pharmacokinetic profiles after simultaneously fitting the data after i.v. and s.c. doses using the proposed model are shown in Fig. 3. The proposed PK/PD model characterizes the time course of IFN-β1a plasma concentrations quite well after both routes of administration. The final estimated pharmacokinetic parameters are reported in Table 2. The relatively low CV% values are also indicative of good model fitting. A dissociation rate constant can be estimated from the binding parameters as KD = koff/kon. When converted to a molar concentration, the estimated KD value (0.403 × 10⁻⁹ M) falls within the reported range for the dissociation constant between IFN-β1a and its receptor (Pestka et al., 1987). Peak drug concentrations listed in Table 1 show that the highest i.v. dose achieved concentrations above the estimated KD (2.84 × 10⁵ IU/ml or ≈4.73 × 10⁻⁸ M), whereas the lowest s.c. dose resulted in lower concentrations (44.0 IU/ml or ≈7.33 × 10⁻¹² M). The volume of the central compartment (51.1 ml/kg) approaches the physiological plasma volume in monkeys (approximately 45–50 ml/kg; Davies and Morris, 1993), especially when considering the variability of the estimate. The estimated value of the first-order absorption rate constant (ka) was 0.104 h–1, which corresponded to the value determined by deconvolution analysis (data not shown). This rate is considerably slower than that of the second absorption rate constant (ka2) of 1.85 h–1. Incomplete absorption was found after s.c. administration, and the bioavailability parameters of the 1 and 3 MIU/kg doses were similar (0.27 and 0.32), whereas the bioavailability of the 10 MIU/kg dose was considerably higher (0.71). This may suggest a saturation of site-specific metabolism or degradation at higher doses of IFN-β1a. However, this could not be captured by adding a Michaelis-Menten component to the s.c. site.
Pharmacodynamics. Rhesus monkeys have been shown to respond to human IFN-β1a and provide a useful preclinical model for studying in vivo kinetics and dynamics (Pepinsky et al., 2001). The mean plasma concentration-time profiles of neopterin after i.v. and s.c. administration of IFN-β1a are shown in Fig. 4. The overall profiles demonstrate a delayed onset and slow return toward baseline, which is qualitatively similar to the response observed in humans (Buchwalder et al., 2000).

Neopterin concentration-time profiles after simultaneously fitting the final PK/PD model to the mean data of three single i.v. (top) and s.c. (bottom) doses of IFN-β1a. 1 MIU/kg (•), 3 MIU/kg (□), and 10 MIU/kg (▴). Error bars represent standard deviations.
The pharmacodynamic profiles resulting after the simultaneous fitting of all three i.v. and s.c. doses using the proposed PK/PD model also are shown in Fig. 4. The proposed model seems to capture the overall time course of neopterin concentrations, with i.v. data being slightly better characterized than s.c. data. The need for the additional DR* and precursor compartments was evaluated by removing one or the other from the model and refitting the data. Based on inspection of the resulting profiles and residual distributions, both compartments were required to describe the significant delay in the onset of drug effect. Estimates of the pharmacodynamic parameters are listed in Table 2. According to the model, the internalized drug-receptor complex forces a 23.8-fold increase in the rate of production of the precursor (Smax = 23.8). This seems responsible for a 6- to 10-fold increase in neopterin concentrations, which is eliminated from the system with an approximate half-life of 37.6 h [ln (2)/kout]. This result is consistent with the finding that a 1-week washout period may be insufficient with regards to the return of the pharmacodynamic marker to baseline values. However, the integrity of the model parameters was most likely preserved since the production rate (k0) was fixed as the product of the mean time-zero neopterin concentration from the i.v. data sets and the kout parameter, which was estimated and is influenced by all single-dose PD data (eq. 10).
An examination of the relationship between the area under the effect curve from time 0 to 96 h (AUEC0–96) and the area under the plasma concentration-time curve from time 0 to infinity (AUCinf) was made as shown in Fig. 5. A significant shift to the left is seen when going from i.v. to s.c. administration indicative of much greater efficacy per AUC value for the s.c. dosing. This shift raises the fundamental question of whether there are changes in pharmacodynamic parameters upon changing routes of administration or the behavior is a natural consequence of the PK/PD properties. A plot of the time course of internalized drug-receptor complex, DR*, was constructed (Fig. 6). Although the i.v. doses produce larger amounts of DR* initially, the s.c. doses produce prolonged DR* values. In particular, the graph shows that for the larger doses, the DR* is maintained above the SC50 value for a lengthy period. This is consistent with simulations showing enhanced indirect responses when drug delivery is slowed compared with i.v. doses (Gobburu and Jusko, 1998).

Relationship between the area under the effect curve from 0 to 96 h (AUEC0–96) and the area under the plasma concentration-time curve from 0 to infinity (AUCinf) for IFN-β1a given i.v. (•) and s.c. (○).

Calculated time profile for the internalized drug-receptor complex (DR*) based on eq. 7 for single i.v. (thin lines) and s.c. doses (heavy lines).
Multiple Daily Dosing. The experimental data obtained during the repeated s.c. administration of IFN-β1a and a multiple-dosing simulation using the pharmacokinetic model (eqs. 1–6) is shown in Fig. 7. The current model failed to characterize the mean IFN-β1a plasma concentrations after the later s.c. doses of 1 MIU/kg given once daily. However, it is important to note that the plasma concentrations during day one were considerably higher than those achieved during the single s.c. dose study (single dose Cmax ≈ 44 IU/ml versus multiple dosing day 1 Cmax ≈ 76 IU/ml). It is unclear at this time why these concentrations were elevated. Regardless, an adjustment to the model for receptor down-regulation (eq. 13) was incorporated to further evaluate the multiple-dosing pharmacokinetics. This approach resulted in the pharmacokinetic profile also depicted in Fig. 7, and well characterized the time course of IFN-β1a concentrations after s.c. daily dosing. The final estimated parameters were IC50,Rmax = 0.00119 nmol/kg (23.5 CV%) and kdeg,Rmax = 0.00517 h–1 (18.6 CV%).

Time course of IFN-β1a concentrations during multiple dosing of 1 MIU/kg s.c. daily (• ± S.D.). Dashed line, simulation of s.c. daily dosing of IFN-β1a with single-dose PK/PD model. Solid line, pharmacokinetic profile of IFN-β1a after modeling the mean s.c. daily-dosing data with the PK/PD model adjusted to accommodate for receptor density down-regulation.
The pharmacokinetic profile shown in Fig. 7, which incorporated Rmax down-regulation, was then used as the driving function for the s.c. daily-dosing pharmacodynamic profile. A simulation based on the pharmacodynamic model (eqs. 7–12) and parameters (Table 2) upon s.c. daily dosing is shown in Fig. 8. Despite the inclusion of maximum receptor down-regulation in the pharmacokinetics, the final pharmacodynamic parameters overestimate the neopterin concentrations after daily dosing. Although it provided some improvement, allowing Smax to be estimated also underestimated concentrations during the first one-third of the monitored time interval (data not shown). This estimated value of Smax was significantly lower than 23.8, as determined from the single-dose PD data. This suggests a time-dependent, and perhaps concentration-dependent, decrease in the value of Smax. This observation supports use of a negative-feedback inhibition of Smax, via a direct inhibition model driven by neopterin concentrations. The resulting pharmacodynamic profile is shown in Fig. 8 and well characterizes the overall s.c. daily-dosing PD profile of IFN-β1a. The final estimated parameters were IC50,Smax = 10.9 ng/ml (15.7 CV%) and τ = 29.3 h (24.2 CV%).

Time course of neopterin concentrations during multiple-daily dosing (• ± S.D.). Dashed line, simulation of s.c. daily-dosing pharmacodynamic profile with single-dose PK/PD model and receptor down-regulation submodel. Solid line, s.c. daily-dosing pharmacodynamic profile after modeling the data with the PK/PD model adjusted to accommodate for neopterin negative feedback inhibition.
Discussion
The primary objective of this study was to design an approach to simultaneously model the PK/PD behavior of IFN-β1a after i.v. and s.c. administration of various dose levels in monkeys. To this end, a fully integrated PK/PD model (Fig. 1) was developed and used to simultaneously characterize the resulting PK/PD profiles.
The proposed model well captured the overall pharmacokinetic profile of IFN-β1a after both routes of administration at each dose level (Fig. 3). The nonlinear pharmacokinetic properties of the drug could be explained in terms of its saturable binding to its pharmacological receptor. The final estimated binding parameters kon and koff reveal a dissociation constant that is consistent with accepted literature values. Despite the inclusion of an alternate pathway, this process represents the primary mechanism of elimination of drug from the system. The significance of the secondary elimination pathway (kloss) can be assessed by comparing the product kloss · Vc (24.5 ml/h/kg) and the apparent clearance values obtained from the noncompartmental analysis of the i.v. single-dose data (Table 1). In this way, kloss accounts for approximately 7.4, 19.0, and 32.4% of the apparent clearance values of the 1, 3, and 10 MIU/kg doses. This suggests that kloss does not represent a significant mechanism of elimination until higher i.v. doses (10 MIU/kg) are administered. This is a logical extension of the hypothesis that the primary elimination pathway (receptor-mediated endocytosis) is saturated at higher doses, resulting in longer persistence and increased opportunities for other degradation pathways.
Slow and incomplete absorption after s.c. dosing was observed and raises the issue of flip-flop pharmacokinetics (i.e., absorption rate controlling the terminal phase). The assessment of whether IFN-β1a exhibits flip-flop pharmacokinetics is confounded by its nonlinear nature. For the lowest dose, λz,i.v. and λz,s.c. are 0.2 and 0.093 h–1, whereas the estimated value of ka was 0.104 h–1 (Table 2). Because ka is less than λz,i.v. and approximately equal to λz,s.c., flip-flop pharmacokinetics is suggested. However, λz,i.v. decreases as dose is increased, and is approximately equal to ka at the highest dose. Thus, true flip-flop behavior is not observed at higher doses, although the slow absorption and disposition rates create prolonged drug exposure. This is confirmed by visual inspection of the mean data, where the i.v. and s.c. terminal phases of the higher doses seem to decline in parallel. In any event, the technique of incorporating a lymphatic compartment with linear first-order absorption rate processes was successful in describing the absorption characteristics of the drug. However, comparing these two rate processes must be done cautiously. The true disposition of IFN-β into and out of the lymphatic compartment is not ascertainable from the data, and simulations show that ka and ka2 are interchangeable (data not shown). The important feature of the absorption model is that the slowest absorption rate constant will still control the overall input rate.
The proposed model attempts to quantify the data in terms of known mechanisms. Further physiological significance of the model was revealed through its estimation of the volume of the central compartment (Vc). The final estimated value of Vc closely resembled the plasma volume of monkeys. This is consistent with the relatively large size of IFN-β1a and, with the exception of specific and nonspecific binding, the compound should mostly reside in the plasma. Although this study was conducted in monkeys, the metabolism and elimination of interferons are similar across most species (Gloff and Wills, 1992), and the model has been shown to be relevant in humans (Buchwalder et al., 2000; Mager and Jusko, 2002).
The time course of neopterin concentration seems to be reasonably characterized by the proposed model (Fig. 4). There were slight deviations in the predicted s.c. pharmacodynamic profiles, for which several factors may be implicated, including a potentially insufficient washout period, the use of mean data and the variability in neopterin concentrations, and potential feedback mechanisms that may be operating as a result of prolonged drug and neopterin concentrations. Future studies will be needed to confirm whether the route of administration has a direct effect that is not reflected in the model. In general, the pharmacodynamic profiles show a gradual and dose-dependent rise in neopterin plasma concentrations, followed by a prolonged and consistent return toward the baseline. Of importance is the fact that the model captures this delay and obviates the need for introducing empirical lag-time parameters. Mechanistically, the time lag may be due to the time required for drug distribution to its biophase, for the interferon to act upon the target enzyme, for the induced enzyme to form the necessary precursor, for the precursor to convert to neopterin, or a combination of these factors. In terms of biophase, the organs that have the highest concentrations of cyclohydrolase in the monkey are the pineal gland, small intestine, liver, and kidney (Fuchs et al., 1992). However, attempts to describe the data using an effect compartment linked to indirect response model III were unsuccessful (data not shown). In any case, a modified precursor-dependent indirect response model is most relevant and was proposed to account for the overall pharmacodynamic properties of the system.
The pharmacodynamic section of the model seems to capture the overall cellular response to IFN-β. In a recent review, Stark et al. (1998) describes the currently understood cellular mechanisms of the IFN-α/β signaling pathway. This pathway is composed of several transduction processes initiated by the binding of IFN to its biological receptor. The authors caution that some steps are better understood than others and that additional novel pathways may also be involved. The rates of internalization (kint) and degradation (kr) used in our model may be viewed as apparent rate constants which are dictated by the rates of these intracellular processes. In either case, the crucial driving function of the response continues to be the generation and loss of the initial drug-receptor complex.
In contrast to traditional PK/PD analyses, where generally the pharmacokinetic component is considered self-determining, and the dynamics is developed separately, our model does not assume that these modules are independent manifestations. A similar methodology has been reported by Kang and Weiss (2002), who simultaneously modeled the cardiac PK/PD properties of digoxin in isolated rat heart. For IFN-β, both kinetic and dynamic processes seem to be related and centered around its receptor binding. Reversible receptor binding has been used to model the in vivo pharmacokinetics of polypeptide hormones (Sugiyama and Hanano, 1989), and a general model for target-mediated drug disposition has been developed (Mager and Jusko, 2001). Our integrated PK/PD model represents a logical extension of this approach and connects the disposition of IFN-β with receptor activation to further characterize the pharmacodynamic signal transduction process. This combined methodology represents the fundamental nature of receptor-mediated drug disposition and effects.
The PK/PD profiles of IFN-β1a after repeated daily administration were appropriately captured once submodels of receptor down-regulation and feedback inhibition were included (Figs. 7 and 8). These are rather common phenomena and can be used to account for the discrepancies encountered in simulations of the basic PK/PD model. Clearly, the extent of receptor down-regulation seems to be modest because the amount of drug accumulation on multiple dosing is small (Fig. 7). Clinically, much lower doses are administered and at a slower frequency, suggesting this process may not be relevant. Our use of indirect response models to describe these processes is not unique. Sun et al. (1998) reported the successful implementation of indirect response models to characterize the receptor/gene-mediated down-regulation of glucocorticoid receptors upon repeated drug administration. Finally, reports from clinical studies with interferons also indicate a decline in the biologic response of biomarkers (including neopterin) after repeated treatment (Fierlbeck et al., 1996). However, a quantitative link between neopterin concentrations and the progression of multiple sclerosis has not been established. Thus, neopterin may represent a useful biomarker, but not a surrogate for the clinical effects of IFN-β.
In conclusion, an integrated PK/PD model was developed to simultaneously characterize both the i.v. and s.c. dosing of IFN-β1a at various dose levels in monkeys. Our approach utilizes the concept of target-mediated disposition to characterize both primary mechanisms of drug elimination and activation. The simple binding process embodied in the model not only provides for the subsequent metabolism and elimination of the drug, but also forms the internalized drug-receptor complex responsible for driving the pharmacodynamic response. The PK/PD model reflects the primary processes by which neopterin is both produced and eliminated. A clear advantage of the model is the ability to estimate or model compartments or substances that are not normally available for sampling (including DR and DR*). Although the basic PK/PD model could not describe the later elevations of IFN-β1a upon repeated s.c. administration, modeling both receptor down-regulation and negative feedback inhibition of neopterin formation suggests insights into changes that may occur under such conditions. Advances in biotechnology and ligand-based combinatorial chemistry promise to deliver a plethora of compounds with high-affinity for target receptors. Therefore, PK/PD models similar to the one presented here may become commonplace and represent the most appropriate manner in which to model these drugs.
Footnotes
-
This research was supported by Serono International and by Grant GM57980 (to W.J.J.) from the National Institutes of Health. Preliminary results were presented at the American Association of Pharmaceutical Scientists Pharmaceutical Congress of the Americas, Orlando, FL, March, 2001.
-
DOI: 10.1124/jpet.103.049502.
-
ABBREVIATIONS: IFN, interferon; PK, pharmacokinetics; PD, pharmacodynamics; CV%, coefficient of variation percent; AL, amount of drug in lymphatic compartment; AUC, area under plasma drug concentration-time curve; AUMC, area under the first moment curve; C0 or Cmax, maximum plasma drug concentration; CL, total systemic drug clearance; DR*, amount of internalized drug-receptor complex; DR, amount of drug-receptor complex at cell surface; Dsci, ith s.c. dose level; Fi, bioavailability of the ith s.c. dose level; MIU, million IU; MRT, mean residence time; Vss, steady-state volume of distribution.
-
↵1 Current address: Gerontology Research Center, 5600 Nathan Shock Dr., Baltimore, MD 21224.
- Received January 23, 2003.
- Accepted March 18, 2003.
- The American Society for Pharmacology and Experimental Therapeutics


