Article Text

Abstract
Objective: The frequency of subtelomeric rearrangements in patients with unexplained mental retardation (MR) is uncertain, as most studies have been retrospective and case retrieval may have been biased towards cases more likely to have a chromosome anomaly. To ascertain the frequency of cytogenetic anomalies, including subtelomeric rearrangements, we prospectively screened a consecutive cohort of cases with unexplained MR in an academic tertiary centre.
Methods: Inclusion criteria were: age <18 years at referral, IQ<85, no aetiological diagnosis after complete examination, which included karyotyping with high resolution banding (HRB).
Results: In 266 karyotyped children, anomalies were detected in 20 (7.5%, seven numerical, 13 structural); 39 cases were analysed by FISH for specific interstitial microdeletions, and anomalies were found in nine (23%). FISH analyses for subtelomeric microdeletions were performed in 184 children (44% moderate-profound MR, 51% familial MR), and one rearrangement (0.5%) was identified in a non-familial MR female with mild MR (de novo deletion 12q24.33-qter). The number of probable polymorphisms was considerable: 2qter (n=7), Xpter (n=3), and Ypter (n=1). A significantly higher total number of malformations and minor anomalies was present in the cytogenetic anomaly group compared to the group without cytogenetic anomalies.
Conclusions: The total frequency of cytogenetic anomalies in this prospective study was high (1:10), but the frequency of subtelomeric rearrangements was low. The most likely explanations are the high quality of HRB cytogenetic studies and the lack of clinical selection bias. Conventional cytogenetic analyses, combined with targeted microdeletion testing, remain the single most effective way of additional investigation in mentally retarded children, also in a tertiary centre.
- mental retardation
- prospective
- screening
- subtelomeric
- MR, mental retardation
- HRB, high resolution banding
- VNTR, variable number of tandem repeats
- HR-CGH, high resolution comparative genomic hybridisation
- BAC, bacterial artificial chromosome
- PAC, P1 derived artificial chromosome
Statistics from Altmetric.com
- MR, mental retardation
- HRB, high resolution banding
- VNTR, variable number of tandem repeats
- HR-CGH, high resolution comparative genomic hybridisation
- BAC, bacterial artificial chromosome
- PAC, P1 derived artificial chromosome
Despite a large number of studies, many causes of mental retardation (MR) remain obscure: an aetiological diagnosis is usually identified in less than 50% of affected subjects.1–3 The frequency of disorders reported as exogenous and genetic causes of MR is remarkably variable: exogenous causes vary from 18.6% to 44.5%, genetic causes from 17.4% to 47.1%, and the aetiology remains unknown in 4.3% to 83%.2–5 These variations have been explained by differences in setting, degree of MR, patient selection criteria, study protocols, and definitions of diagnoses.
It is well established that, especially in severe MR, numerical and structural chromosome anomalies are the most commonly identified cause, seen in 9-36% of patients.3,6,7 In recent years, the role of cryptic chromosomal rearrangements in the aetiology of MR has become more evident8: an increased number of abnormalities found in “non-deleted” patients who show a phenotype characteristic of a known microdeletion; the growing number of recognised interstitial microdeletion syndromes; and the detection of tiny deletions/duplications in carriers of more complex (seemingly balanced) rearrangements. Furthermore, several rare entities thought to show Mendelian inheritance have been proven to be caused by a submicroscopic chromosome anomaly, an example being GOMBO syndrome, which was found to be caused by a cryptic 3;22 translocation.9 Some of the so called “private syndromes” may be similarly explained in the near future.
The hypothesis that cryptic rearrangements affecting terminal chromosomal regions may play a role in the aetiology of MR prompted Flint et al10 in 1995 to screen a series of such patients with normal karyotypes for submicroscopic anomalies in 28 (of the 41) subtelomeric regions, using variable number of tandem repeats (VNTR) polymorphism analysis.10 Based on their findings, they estimated that as much as 6% of unexplained MR may be caused by subtelomeric aberrations. Screening subtelomeres for rearrangements should provide a high yield, as in the majority of translocations chromosome ends are involved, and regions adjacent to telomeres are gene rich.11 Thus, aberrations involving subtelomeric DNA are likely to have phenotypic consequences including developmental delay.12
For screening telomeres, good quality high resolution chromosome preparations are needed, followed by several possible techniques13: FISH analysis using subtelomeric probes14–18; analysis with microsatellite markers19–23; or high resolution comparative genomic hybridisation (HR-CGH).24 The former is the most widely used as it is easily applicable and sensitive, detecting small rearrangements. However, it does not provide information about the parental origin as does VNTR marker analysis, nor does it cover the entire genome, as in HR-CGH.
Several studies, including our own pilot study, reported frequencies of subtelomeric anomalies between 4% and 16%,8,10,14,15,19,21,22,24–31 comparable to the results of Flint et al.10 This variation may be attributed to differences in one or more of the following: quality of chromosome preparation and banding; different study techniques (FISH v microsatellite analysis v CGH); methods of reconfirmation (if any) of detected cytogenetic anomalies; and inclusion criteria, recruitment methodology, and initial clinical evaluation of study subjects.8 Except for one recent prospective study,17 most studies have been (partly) retrospective. In most studies, case retrieval was from different sources and not a consecutive cohort of cases. This may have introduced a bias in favour of cases more likely to have a chromosome anomaly, such as familial cases with MR or cases with a suspect “chromosomal phenotype”. The true prevalence of subtelomeric rearrangements in MR is therefore still not well established. This encouraged us to initiate the present, prospective study to screen for subtelomeric anomalies in a consecutive group of children with MR of unknown origin.
METHODS
MR: definition and assessment
The definition of the American Association on Mental Retardation was used to define mental retardation.32 For each patient, the level of cognitive functioning (IQ) was determined using either the most recent formal intelligence test result (usually one of the Wechsler scales), or in case this was not available an estimation of the level of functioning by a single experienced observer (RCMH). The degree of MR was subsequently categorised according to the World Health Organization classification33 and DSM-IV criteria34 into profound (IQ <20), severe (IQ=21-35), moderate (IQ=36-50), mild (IQ=51-70), and borderline (IQ=71-85).
Setting and selection of patients
The study was prospectively performed in an academic medical centre functioning as a tertiary care centre. The study cohort comprised all consecutive patients with MR of unknown cause younger than 18 years referred to the outpatient clinic of a single paediatrician-clinical geneticist during the period 1 November 1998 to 1 November 2000. Of monozygotic twins, only one was (randomly) included in the study group. This outpatient clinic is used as a specialised clinic for aetiological diagnostic studies in subjects with MR. The vast majority of patients are referred by paediatricians, paediatric neurologists, and clinical geneticists either from their own medical centre or from other hospitals. Therefore, patients with well known entities such as Down syndrome, fragile X syndrome, or Prader-Willi syndrome are generally not referred to this clinic, unless their phenotype is atypical for the entity.
All patients were examined by a single paediatrician-clinical geneticist. Diagnostic studies were performed as usual for patient care purposes. Standard assessment included history taking of the prenatal, perinatal, and postnatal period; medical history including all surgery, admissions to hospitals, medication use, and results of previously performed diagnostic investigations; a three generation pedigree with special attention to the presence of MR, psychiatric disorders, and congenital anomalies; physical examination focused on the presence of minor anomalies and malformations; anthropometry; neurological examination; and assessment of the behavioural phenotype. If findings of the clinical work up were suggestive of a particular aetiological diagnosis, additional investigations for its reconfirmation were performed. For example, suspicion of the presence of Rett syndrome warranted MECP2 gene mutation analysis. If no diagnosis was clinically evident, cytogenetic high resolution studies (550-650 bands) as well as metabolic investigations (including standard urinary analysis and screening for glycosylation defects and for cholesterol metabolism disturbances) were carried out in all patients. If clinically an aberration of a specific subtelomeric region (such as 4p−) was suspected based on the phenotypic findings, FISH was performed using these probes only. If a rearrangement was detected, the patient was not included in the subtelomeric screening group. The methodology of the diagnostic work up will be described in more detail elsewhere (van Karnebeek et al, submitted).
If after the above mentioned diagnostic work up no causal diagnosis was established, FISH analysis of all subtelomeric regions was performed. The FISH studies were also performed in patients with known entities of which the aetiology is still unknown and which do not clearly follow a Mendelian pattern of inheritance, such as CFC syndrome, as these entities may still be caused by small chromosome anomalies.
Chromosomes
Metaphase chromosome preparations were obtained from peripheral blood cultures and GTG banded chromosomes were always examined at a 550 to 650 band level. FISH analysis of the subtelomeric regions of all chromosomes was performed using the Chromoprobe MultiprobeT kit (Cytocell, Banbury, UK),35 with minor adaptations in the protocol. During the course of our study period, Cytocell made the following changes in applied probes: region 5pter (114J18 to 189N21); region 15qter (124O5 to 154P1); region 18pter (52M11 to 74G18); and XpYpter (CY29 to 839D20). Two investigators each scored a minimum of five metaphases per probe focusing on deletions, duplications, and balanced translocations involving the subtelomeric region of every chromosome. Metaphases were accepted for analysis if both the p arm and the q arm of both chromosome homologues could be scored. Results were considered conclusive if the first five metaphases were 100% concordant. If a probe on the multiprobe device could not be scored, FISH was performed separately using the specific subtelomeric probe (either commercially available or home made). If an abnormality was suspected, results were reconfirmed in a similar fashion, with the exception of the subtelomeric region of chromosome 2q for which the BAC probe RG-172-I13 was used instead of the PAC probe GS-1011-O17 on the device. In case of a reconfirmed abnormality, the parents were karyotyped, whereafter the subtelomeric region was investigated first through FISH analysis and subsequently at a molecular level. For further analysis of the female showing a deletion of the subtelomeric deletion of region 12qter (using probe 221K18), the following BAC probes (http://dev.ensembl.org/Homo_sapiens/cytoview) were used: RP11-50715, RP11-205M16, RP11-526P6, RP11-112B19, and RP11-394D10.
Molecular analysis
If no parental anomalies were found on karyotyping and subtelomere studies, a possible rearrangement was further investigated by microsatellite PCR analysis using standard molecular procedures. Microsatellites were obtained from genome databases (http://www.genome.wi.mit.edu) (http://www.gdb.org/) or from sequences from mapped clones.23 The microsatellites used specifically for reconfirmation of the suspected 2qter deletions included markers D2S125, D2S2987, D2S2585, and D2S2986.
Statistical analysis
All data on each patient obtained through the described work up were entered in the “Amsterdam Dysmorphology DataBase”, an SPSS database (version 10.0.7) designed specifically for entry and analysis of data regarding phenotype, (prenatal, perinatal, postnatal) clinical history, family history, and results of additional investigations.
Classification of phenotypic anomalies
Phenotypic anomalies were classified as a spectrum variant, minor anomaly, combination of the latter two, mild malformation, major malformation, or a malformation of uncertain type based on an adapted version of the classification proposed by Marden et al36 (Merks et al, in preparation). For the present study, the classification of phenotypic anomalies was simplified into two categories: minor anomaly or malformation.
Approval and consent
The study was approved by the Medical Ethical Committee of the Academic Medical Centre in Amsterdam. Informed parental consent was obtained before inclusion in the study.
RESULTS
Numerical and structural chromosome aberrations
The results of the complete diagnostic work up of the 281 patients (162 males) will be described elsewhere (Van Karnebeek et al, submitted). Here we report only on the identified cytogenetic anomalies. High resolution chromosome banding was performed in 266 (94.7%) subjects. Reason for lack of karyotyping in the remaining 15 included: no permission from parents for venepuncture (n=8), lymphocyte harvest unsuccessful (n=2), other non-chromosomal diagnosis immediately apparent at consultation (n=5). Of the 266 screened subjects, anomalies were identified in 21 (7.9%, eight numerical, 13 structural), listed in table 1. The balanced translocation patient No 20 (table 1) also with a microdeletion of the Williams region was considered a coincidental finding. The apparently balanced translocation in patient No 10 was found to be de novo, and may have been the cause of the MR. Therefore, the total frequency of microscopically visible aberrations was 7.5%.
All cytogenetic anomalies detected in the present study population (n=266)
Microdeletion syndromes
FISH analysis of regions responsible for specific well known microdeletion syndromes was performed in 39 patients (Williams region 7q11, n=3; PW/AS region 15q11-13, n=11; RTS region 16p, n=5; Smith-Magenis region 17p11, n=1; VCF region 22q11, n=21) (in two cases, two microdeletion studies were performed). In nine cases (23%), aberrations were detected: Williams syndrome in one male and in one female, VCF syndrome in three children, Prader-Willi syndrome in one female and two males, one of whom who also had an XYY karyotype, and Angelman syndrome in one male. In the latter three patients, abnormal methylation patterns had earlier been detected by molecular analysis.
Subtelomeric screening
Subtelomeric screening was warranted in 206 subjects. However, 22 of these were excluded for lack of permission from parents for venepuncture (n=14), lymphocyte harvest unsuccessful three or more times (n=6), or patients lost to follow up (n=2). Thus, 184 cases (108 males) were studied with terminal probes, including four sib pairs and one sib trio of whom only one of each pair/trio was screened. In 118 patients (71 male), MR was of unknown aetiology; in 61 (37 male) an aetiological diagnosis was made but the entity was of unknown cause; in five subjects a teratogenic influence was suspected, but screening was still performed to rule out other causes; in 15 patients a diagnosis with a known cause was made during the course of the study and they were thus deleted from further description of the study, leaving 184 cases (108 males). In 57, the fragile X syndrome was excluded molecularly.
In only one (0.5%, patient No 29 in table 1) of the 184 screened children, a female with mild, non-familial MR, a submicroscopic deletion of 12qter was detected on the multiprobe instrument, subsequently reconfirmed by separate FISH analysis using the same BAC probe 221K18, located in band 12q24 at 180 kb from the telomere. Further FISH analysis with BAC clones showed the breakpoint to be located between clone RP11-112B19 (12q24.32, deleted) and RP11-526P6 (12q24.33, not deleted). Analysis of parental samples with the same clones showed the subtelomeric rearrangement to be de novo. In retrospect, the microdeletion was not visible in the high resolution karyotype. Results of further molecular analysis are pending.
There were 11 polymorphisms (6%): a polymorphism of 2qter in seven patients (four male), a Xpter polymorphism in three (two male), and a Ypter polymorphism in one male. Six of the seven patients with a 2qter polymorphism showed a deletion with PAC probe GS-1011-O17 (located 240 kb from telomere), but two normal signals with the BAC probe RG-172-I13 (240-290 kb from telomere); parental samples were not investigated. The seventh patient showed a deletion with both probes, as did her father, and molecular analysis reconfirmed a 2q37.3-qter deletion with breakpoints between markers D2S125 (present) and D2S2987 (deleted). The father showed only one allele for both markers, indicating the same deletion. The phenotype of the seven patients with 2qter anomalies was compared to the main phenotypic features of patients with molecularly confirmed deletions of subtelomeric region 2q37.37 The resemblance was limited except for the female with the molecularly reconfirmed deletion of 2q37.3-qter, who had eight of the main features: mild MR, round face, sparse hair, frontal bossing, upward slanting palpebral fissures, strabismus, short terminal phalanges, and sandal gap. She also suffered epilepsy and eczema, as well as hyperactive and aggressive behaviour, all features which have been described in patients with del(2qter), albeit less frequently. Therefore we cannot exclude the clinical significance of the deletion in this case, despite the presence of the same deletion in her unaffected father.
All three subjects with an Xp polymorphism as well as the male with a Yp polymorphism showed a deletion with cosmid probe CY29 (located <25 kb from telomere), while normal signals were present with BAC probe 839D20 (160 kb from telomere).
DISCUSSION
Frequency of detected cytogenetic anomalies
Excluding subtelomeric rearangements, the total frequency of detected cytogenetic anomalies is 10.9% (29/266). If only aberrations visible by light microscopy are counted, the frequency is 7.9% (20/266), which is lower than in other studies. The preselection because of the referral pattern to a tertiary care centre will probably be the main explanation for this figure; subjects with obvious, often more common cytogenetic anomalies have usually already been diagnosed by a paediatrician and are not referred to our clinic. The 1 in 10 detection rate is probably representative of the frequency of cytogenetic anomalies in patients with MR seen in tertiary care centres, and concurs with the rate of 11.6% reported recently for a similar population.1
Frequency of detected subtelomeric rearrangements
With only one (0.5%) subtelomeric deletion (CI –3.34 to 3.36) detected through the screening of 184 consecutive children with MR of unknown origin, we conclude that subtelomeric rearrangements are not a common cause of MR in this prospective tertiary centre study. Current publications13 suggest that the yield of subtelomeric screening in patients with unexplained MR depends foremost on the quality and resolution of chromosome studies as well as the nature and severity of the clinical phenotype. In the present study the quality of chromosome studies was high in all subjects under investigation. Two chromosome anomalies (table 1, Nos 8 and 17) both involving subtelomeric regions might have been missed if a lower resolution level of G banding had been used. Our findings agree with those of Joyce et al17,38 that high resolution banding can already detect most “cryptic” subtelomeric anomalies. This may explain in part the present low yield of subtelomeric FISH studies. Second, it has been suggested that in patients with more expressed MR, the yield of subtelomeric screening is higher. In the present study group, MR was graded as moderate to severe in 44%, which is lower than most other studies.8,10,14,29,39 If the percentage of expected subtelomeric anomalies is calculated using previously reported rearrangement frequency figures (7.4% in subjects with moderate to severe MR, 0.4% in those with mild MR),27 the expected number of anomalies would have been 6.4. It is remarkable that the degree of MR in the single patient with a cryptic subtelomeric deletion was mild.
The difference in yield between the present and other studies may also be explained by the fact that not all studies have excluded the possibility of polymorphisms.15,24,39 If the present patient with a familial 2qter deletion does not have a polymorphism but a true subtelomeric rearrangement, the yield in the present series would double. Furthermore, we did not search for subtelomeric microdeletions in patients with a cytogenetic anomaly visible by light microscopy, thus possibly missing concurrent microdeletions. The chance of such an event is very low, however. Other explanations are the prospective nature of the present study and consecutive patient recruitment which may have diminished biases possibly present in earlier studies; the investigation of cases with clinically recognisable microdeletion syndromes (such as 4p−) by separate FISH focused on this anomaly, and, if present, exclusion from the subtelomeric screening; and the difference of the present study cohort from other telomeric study groups in the proportion of cases with familial MR and the number of dysmorphic features. A positive family history for MR, especially with two or more affected members, has been considered another indicator of a subtelomeric defect.40 In the present study half of the MR cases were familial. As only one subtelomeric defect was found (in a family negative for MR), no further correlation studies are possible.
In previous subtelomeric screening studies, the presence of dysmorphic features has been applied as an important selection criterion.14,15,17,19,21,25 However, usually the term “dysmorphic features” was not further defined and findings were not divided into the different categories, both of which are mandatory when comparing phenotypes. Dysmorphological investigation is usually subjective and only rarely can traits be quantified. The lack of clear definitions for some of the symptoms, the absence of reference standards for normality, and the absence of reliable incidence figures that take into account age and ethnic origin hamper definitions. For the present study we used the definitions of minor anomalies and malformations based on the study of Marden et al36 and a more recent editorial.41 The symptoms of the present patients were thus scored and analysis showed a near normal distribution (Gaussian curve) for the total number of abnormal structures/body regions as well as the number of minor anomalies (see Appendix 1). Compared to the normal newborns investigated by Marden et al,36 the average number of minor anomalies was higher in the MR subjects ( 0-3 v 8-11, respectively). The percentage (31%) of cases in the present study having three or more phenotypic abnormalities (minor anomalies and/or malformations) is similar to the figures in earlier studies.8,27,29,40,42 Therefore, the phenotypic anomalies in the present cohort were not less frequent than those of other screened groups, and provide no explanation for the lower yield of subtelomeric deletions.
Finally, it cannot be excluded with certainty that the low detection frequency is the result of chance.
Polymorphisms
Polymorphisms of the 2qter and Xp/Ypter regions using PAC (GS-1011-O17) and cosmid (CY29) clones, respectively, have been reported in previous studies.8,27,43 The 2qter region is known to comprise segmental polymorphisms, which may explain the difficulties in devising a unique and valid probe for analysing this region.44 The sequences of the region located 240-290 kb from the telomere supposedly comprise sequences unique to the 2qter subtelomeric region, shown by the 2112V-I probe located there, which has not shown any polymorphisms so far (H Riethman, personal communication). Probe GS-1011-O17, initially used in our study, is located in the region of the second segmental polymorphism. Probe RG-172I13, used thereafter, is located more distal to the telomere and contains probe 2112V-I. This explains the findings in six of seven patients. In the remaining patient and her unaffected father, however, the deletion was present using both probes, reconfirmed by molecular analysis, and had identical breakpoints. One possible explanation for the findings is that the MR of the child is the result of another, unrelated, and as yet undetected disorder. In this situation the lack of phenotypic effects of the 2qter aberration can be explained by an absence of genes that are critical in haploinsufficiency in the region, as shown for the 16pter region.45 However, as the phenotype in our patient resembled the Albright hereditary osteodystrophy-like (AHO-like) phenotype, it seems more likely that the 2qter deletion is not a polymorphism, the discordance between father and daughter possibly being explained by mosaicism for the deletion in the father. Another explanation may be provided by telomere position effect, or rather the reversible silencing of gene(s) near a telomere by mechanisms that depend both on telomere length and on the distance to the gene.46 Possibly within the remaining chromosome 2qter the organisation of heterochromatin v euchromatin is different between father and daughter as a result of crossovers between maternal and paternal chromosomes, which can lead to a difference in repetitive DNA and in distance of the recapped or newly synthesised telomere to still present gene(s).47 In summary, extensive further analyses are needed of the structure of subtelomeric regions such as 2qter and of the mechanisms controlling expression of genes in the region. The considerable number of polymorphisms in the present study underlines the need for this. Until then, caution is warranted when interpreting results of similar FISH studies.
CONCLUSIONS
In children with MR of unknown origin referred to a tertiary care clinic, cytogenetic anomalies were still found to be present in as many as 1 out of 10 cases. The true rate is undoubtedly higher as submicroscopic interstitial anomalies were not screened for in the present study. High resolution chromosome studies are costly, but prove to have a high yield. Therefore we suggest that in tertiary settings high resolution chromosome studies should remain part of standard patient care in all patients with MR, regardless of phenotype and family history, unless non-cytogenetic causes of MR are evident through history taking and physical examination. FISH screening for subtelomeric rearrangements has a much lower yield and should be performed selectively using stringent selection criteria.12,21,48 Selection criteria may be found in the use of checklists.40 The number of detected subtelomeric anomalies in our study was too small to allow determining the value of this checklist. As there is no rationale to assume that subtelomeric anomalies differ in phenotypic effects from cytogenetic anomalies detected by other means, we have applied the checklist for all cytogenetic anomalies, and did not find the checklist to have a sufficiently high discriminatory power (for details, see Appendix 1). Submicroscopic subtelomeric rearrangements may be studied by other, more efficient techniques, such as high resolution genomic microarrays that have the advantage of also detecting interstitial anomalies.49 Finally, the role of subtelomeric rearrangements in the pathogenesis of MR is not always certain, especially as cryptic subtelomeric abnormalities have now also been detected among controls.17 To ascertain the true frequency of subtelomeric rearrangements in subjects with MR, large prospective screening studies should be performed similar to the present one but in different patient settings, such as in population surveys, schools, hospitals, and institutions for the mentally retarded.
APPENDIX 1 COMPARISON OF PATIENTS WITH AND WITHOUT A CYTOGENETIC ANOMALY
To study whether the phenotype of MR subjects with a cytogenetic anomaly (group B/n=29) differ from those without a cytogenetic anomaly (group A/n=183), we compared several clinical characteristics.
Group A comprises 117 subjects with idiopathic MR and 66 with a known diagnosis of unknown cause. Statistical analysis showed that the two subgroups of group A (with a diagnosis of unknown cause v without any diagnosis) did not differ significantly for any of the characteristics listed in table 2, except for prenatal growth retardation (35% v 19%).
Comparison of the main patient characteristics of the present study population between patients with and without a cytogenetic anomaly
Group B comprises 20 subjects with a microscopically visible (structural or numerical) anomaly, nine with a submicroscopic anomaly, and one with both types of anomalies. There were no statistically significant differences between patients with a microscopically visible anomaly v a microdeletion, except for (chromosome anomalies v microdeletions) small ears (5% v 40%, p=0.013) and ectodermal abnormalities (86% v 10%), of which notably hair abnormalities differed (80% v 40%, p=0.023). The total number of minor anomalies, malformations, and abnormal structures did not differ between the subgroups of B, which shows that the phenotypic effect of a chromosome anomaly depends much more on its locus and the function of the genes involved than on its size. Differences between structural chromosome anomalies visible by light microscopy versus those only detectable by FISH analysis are gradual, and distinction between the two is made based on gradual differences in resolution of techniques, rather than differences in their respective phenotypic effects. We therefore found it justified to pool them together in group B.
In table 2, the totals of group A without a cytogenetic anomaly (n=183) are compared to the totals of group B with a cytogenetic anomaly (n=29). When interpreting the results of this comparison, it must be realised that group A may still comprise patients with a cytogenetic anomaly: cryptic aberrations in interstitial regions were not systematically screened for in this study.24 The male predominance is similar in groups A and B, and reflects the gender ratio of the total MR study group (n=281).The degree of MR is also similar in both groups, contrary to an earlier study in which the degree of MR in the cytogenetic anomaly group was more severe.27
Fig 1 depicts the frequency of the total number of abnormal body regions/structures in patients of group A, compared to those in group B. Subjects with a cytogenetic anomaly display a significantly higher number of abnormal structures/regions than those without. This was most striking for the nose, mouth, and abdomen. Body regions/structures less often abnormal in the cytogenetic group were hair, genitalia, back, and joints. Fig 2 shows the significantly higher total number of minor anomalies per patient in the cytogenetic group B. A higher mean number of minor anomalies was especially found for the mouth, neck, abdomen, and hands. Specific dysmorphic features more often present in group B were prominent/high nasal bridge, macrostomia, micro-/retrognathia, small ears, webbing of neck, abnormal size of the thorax, small hands, and abnormal hand creases. No significant differences between the two groups were found for the presence of other features, including microcephaly and macrocephaly.

Total number of abnormal structures/body regions for patients of group A (no cytogenetic anomaly detected) compared to group B (with a chromosome defect visible either by light microscopy or by FISH).

Total number of anomalies per patients in group A compared to B.
The hypothesis formulated by Opitz,41 that chromosome anomalies disturb the process of developmental fine tuning resulting in an abnormal generalised body scheme, is supported by the present study in which children with cytogenetic anomalies suffered a significantly higher number of and more widespread minor anomalies than children without cytogenetic anomalies. The number of individual minor anomalies significantly more common in group B compared to group A was insufficient to allow the development of a specific checklist for more targeted cytogenetic screening.
Although malformations of facial and non-facial structures were present more often in group B, this difference was not significant. In contrast to minor anomalies and abnormal body structures, the distribution of the total number of external malformations did not show a Gaussian curve (data not shown). The number of CNS malformations was also higher in subjects with a cytogenetic anomaly, but not significantly so. For internal anomalies no differences were found except for the heart and great vessels, which affected the cytogenetic group significantly more often, also if the three cases with VCF were excluded from group B.
Prematurity and prenatal growth retardation, considered earlier as good indicators of subtelomeric defects,40 were present with similar frequency in both groups. Postnatal growth retardation was more common in the cytogenetic anomaly group. Gross asymmetry in growth was present in two subjects, one with a chromosome anomaly, the other without. Familial MR was present significantly less frequently in group B with cytogenetic anomalies, which is in disagreement with a previous study.27 However, the fact that more than 90% of the anomalies in the present study were de novo may explain the limited presence of familial MR, as unbalanced chromosomal rearrangements have been found to segregate with MR.40 Finally, the parents of children with cytogenetic anomalies had significantly more often a history of two or more miscarriages, as previously reported.
Checklist
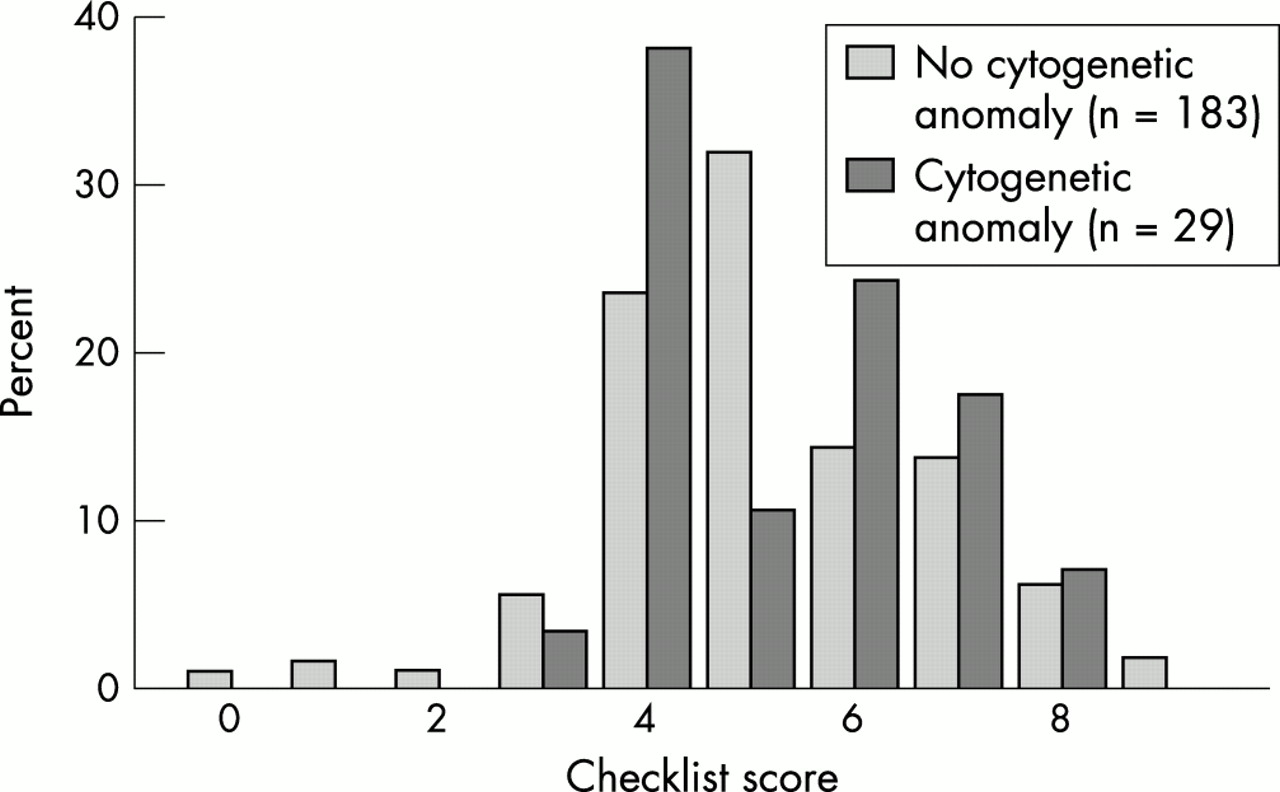
As there seems to be no (published) rationale for assuming differences in phenotypic effect between microscopic and submicroscopic anomalies, whether these be interstitial or subtelomeric, we applied a recently designed checklist to all patients with a cytogenetic anomaly,40 to study whether this might provide an effective preselection for subtelomeric testing, to patients in the present study (fig 3). In the checklist, differentiation between a family history of MR compatible with Mendelian inheritance and a history not compatible with Mendelian inheritance is asked for, but this was often impossible to determine. Therefore, the presence of familial MR irrespective of possible pattern of inheritance was scored 1 point and the highest total score was 9 instead of 10. The average score for group B (mean 5.3, median 5, range 3-8) is slightly higher than the score in group A (mean 5.2, median 5, range 0-9) (fig 3), but not statistically significant (p=0.75). This is in agreement with other recent reports.50,51
Checklist score per patients of group A compared to group B.
If the different items of the checklist are considered separately, three items were present significantly more often in the cytogenetic anomalies group: postnatal growth retardation, minor facial anomalies, and cardiac malformations. The latter also holds if patients with a microdeletion of region 22q11 were excluded.
Had we applied a cut off score of >4, 17 patients (7%) could have been excluded from cytogenetic screening, but one (3.4%) patient with a cytogenetic anomaly would have been missed. For a cut off score of ≥6, the number of tested patients would have been reduced by 118 (56%) to 65 but 15 anomalies (51.7%) would have been missed. Six patients with a subtelomeric deletion either from this study or from a pilot study26 had a mean score of 4.7 (2, 4, 4, 4, 8, and 6, respectively).
We concluded that using this checklist for all cytogenetic anomalies did not have sufficient discriminating power to preselect candidates with MR for cytogenetic screening in the present study population.
Acknowledgments
This project was financially supported by a grant from the “Stichting Klinische Genetica Amsterdam”. We are grateful to the patients and their parents for their cooperation in this study project. We thank Professor H Riethman (Philadelphia, USA) for supplying information on the 2qter region; the Sanger Centre Clone Resources Group (Cambridge, UK) for providing us with the PP11-BAC clones; Dr Jonathan Flint (Oxford, UK) for providing the individual subtelomeric clones; M Bagnay, S Oldenburg, and M Rahanra for performing cytogenetic analyses; and F Scheper for assistance in data collection and database work.