Article Text

Statistics from Altmetric.com
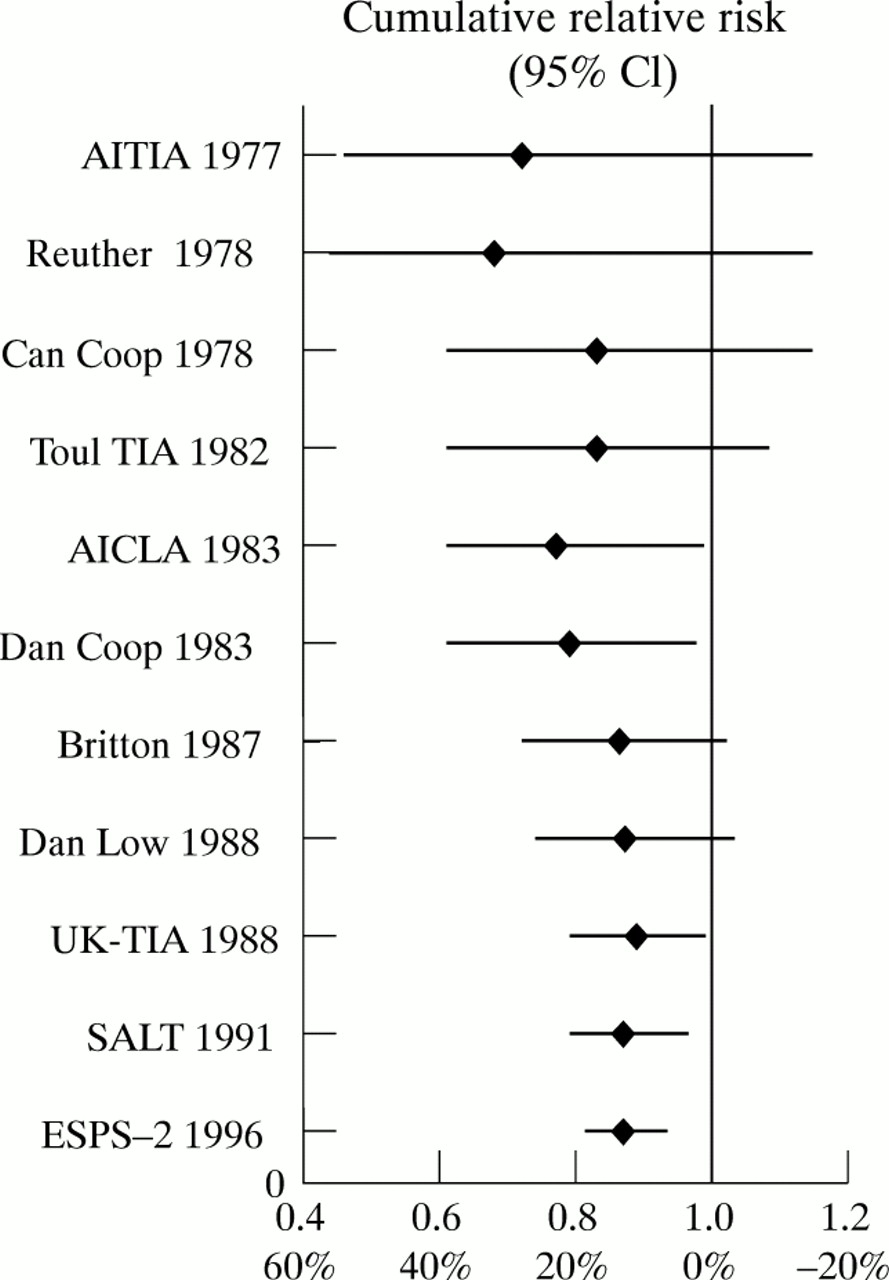
In 1996 we reported in this Journalthat there was virtually no difference in relative risk reduction for low (<100 mg/day), medium (300 to 325 mg/day), and high (>900 mg/day) doses of aspirin in the prevention of vascular events in patients with cerebral ischaemia of arterial origin.1 A meta-analysis of the cumulative data showed a modest 13% (95% confidence interval (95% CI) 4% to 21%) relative risk reduction. Recently the final data of the second European Stroke Prevention Study (ESPS-2) were reported.2 One of its comparisons was between 50 mg aspirin daily and placebo in patients after cerebral ischaemia; the relative risk reduction of 13% (95% CI 0% to 24%) was exactly the same as that resulting from our previous meta-analysis. This similarity allows the calculation of an update of the meta-analysis. The overall relative risk reduction of course remains 13%, but the 95% CI has narrowed to 6% to 19%. The figure shows the results of the updated cumulative meta-analysis, in chronological order. These data once more underscore the need for more efficacious treatment strategies. For this reason we started the European and Australian Stroke Prevention in Reversible Ischaemia Trial (ESPRIT).3

Cumulative meta-analysis in chronological order (1977 to 1996) with relative risks and corresponding relative risk reductions with 95% CIs. Each line represents the relative risk and 95% CI of that study combined with all previous studies.