Article Text

Statistics from Altmetric.com
Because of its low cost and ease of use at the bedside, continuous electroencephalography (EEG) has become widely performed to measure electrical brain activity and to monitor neurological status of patients with severe brain injury.1 Nonetheless, the exact relationship tying spontaneous electroencephalographic activity recorded acutely after traumatic brain injury (TBI), the unfolding of secondary brain damage processes in the subacute and chronic settings,2 3 and functional outcome remains poorly understood. The present study begins bridging this gap, adopting a multimodal approach combining EEG spectral analysis,1 magnetic resonance (MR)-based measures of brain pathology2 3 and clinical outcome at 6 months. Specifically, we perform three analyses: (1) we assess the relationship between acute EEG spectral features and 6-month outcome; (2) we assess the relationship between acute EEG spectral features and subcortical atrophy over the first 6 months postinjury; and (3) we bring together EEG, MRI and other covariate variables in a multimodal analysis predicting 6-month outcome. Our results suggest that alpha and delta frequencies recorded acutely at the bedside predict left dorsal and ventral thalamic atrophy and functional recovery at 6 months postinjury.
In an observational, non-interventional, longitudinal study, we retrospectively analysed a convenience sample of 13 adult patients with severe TBI (21–77 years old; see online supplementary etable 1 and online supplementary information) admitted at the University of California Los Angeles (UCLA) Neurointensive Care Unit with an initial Glasgow Coma Scale (GCS) score of ≤8 or 9–14 with evidence of intracranial bleeding, and who did not show, within 8 hours of admission, GCS score >14 or brain death. Patients with epileptic seizures, pre-existing neurological disorder, overwhelming concurrent hepatic, metabolic encephalopathy, or burst-suppressing sedation were excluded. At a 6-month follow-up, the average outcome, as measured by inperson Glasgow Outcome Scale—Extended4 assessment (henceforth, GOS-E6m), was 4.5 (see online supplementary etable 1). Informed consent was obtained from the legal surrogate, as per the protocol.
Supplemental material
Supplemental material
One-hour, out of 24 hours, resting EEG acutely collected and selected in correspondence of the highest GCS score was acquired on a 10-channel 10–20 montage (Cz referenced). Data were analysed using EEGLAB (https://sccn.ucsd.edu/eeglab/index.php). The continuous signal was segmented into 1 s epochs, and the power spectrum in the alpha (8–13 Hz), theta (4–7 Hz) and delta (1–3 Hz) frequencies was calculated with a fast Fourier transform with a Hanning-tapered window. The average and variance of spectral power across epochs were calculated (see online supplementary information for details). Because of substantial correlations, the average and variance for each frequency were entered into a principal component analysis (PCA), with varimax rotation, which returned three components used for all subsequent analyses: alpha power (average and variance) component, delta power average component and delta power variance component (see online supplementary information). The same PCA approach was applied to confounder variables, returning three components (included in all analyses): age/sex component, experimental variables component (loaded on positively by the time postinjury of the acute MRI and days between acute MRI and acute EEG acquisition, and negatively by peronecent brain volume change over time) and sedation-level component. A linear regression uncovered a significant positive association between the alpha component and GOS-E6m (β=0.62, p=0.011) and a marginally significant negative association between the delta variance component and GOS-E6m (β=−0.386, p=0.079), which became non-significant once covariate components were included.
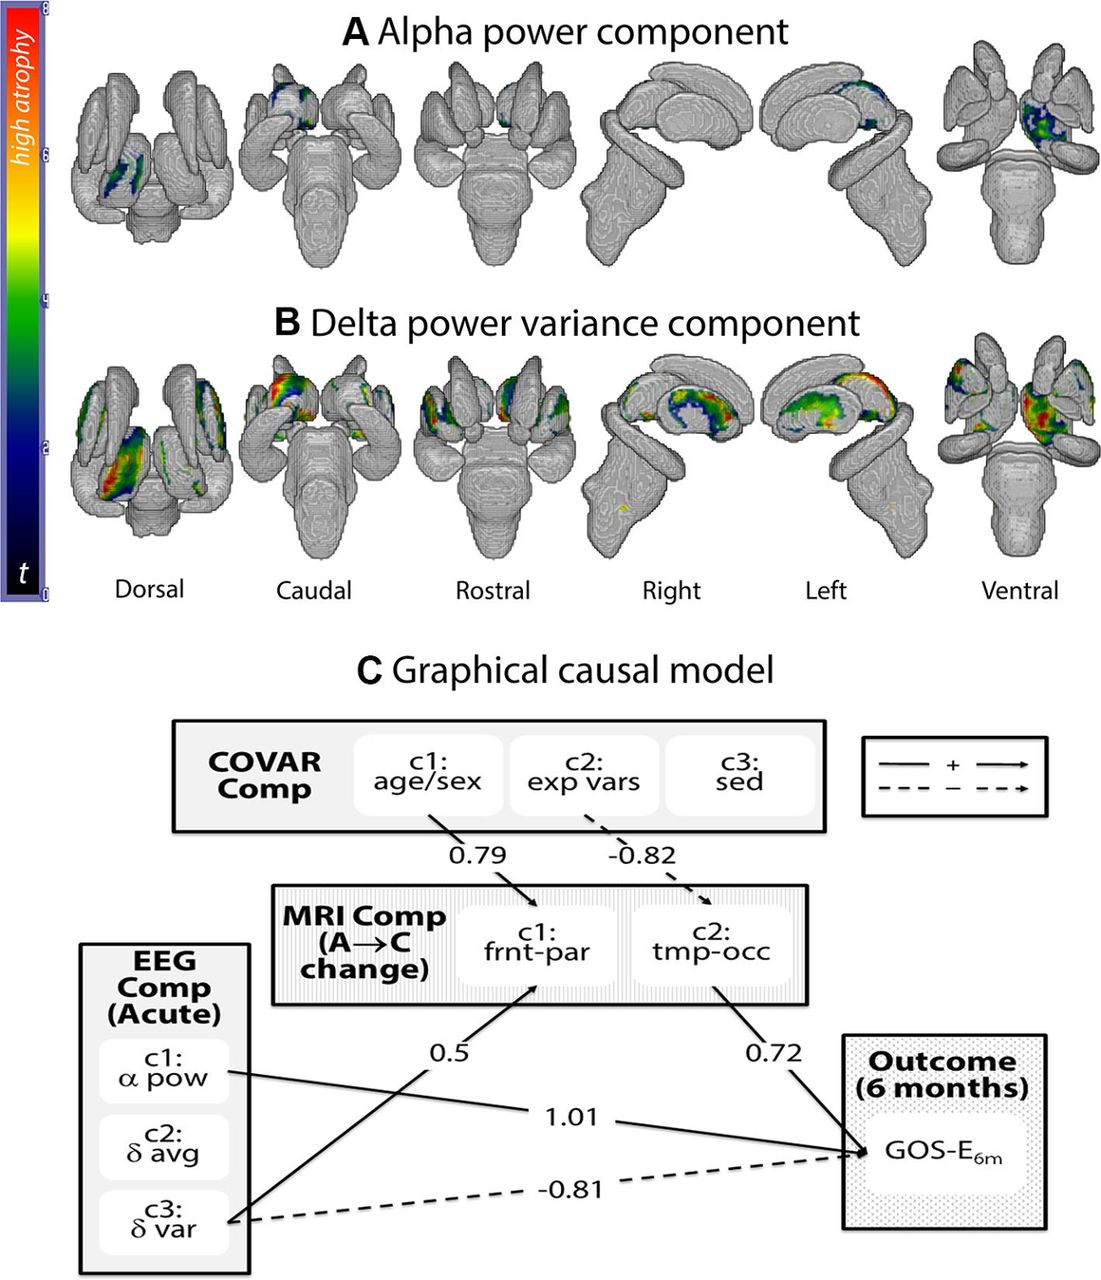
Acute and 6-month follow-up T1-weighted (MPRAGE) structural data (repetition time (TR): 1900–1970 ms; echo time (TE): 3.52–4.40 ms; flip angle (FA): 9–15°) were acquired across three different Siemens MR systems available at the UCLA Ronald Reagan Medical Center (see online supplementary information). A shape analysis of subcortical regions of interest (ROIs: brainstem and bilateral thalamus, globus pallidus, striatum, and hippocampus) was performed using FSL (https://fsl.fmrib.ox.ac.uk/fsl/fslwiki/), using a previously published procedure3 (see online supplementary information). Briefly, data were brain-extracted with optiBET, and ROIs were segmented and transformed into three-dimensional meshes which can be compared across time/patients. Local shape change—that is, displacement of vertices along their normal over time—is conventionally interpreted as atrophy when inwards. Nonetheless, this is an indirect measure based on shape change (see online supplementary information). All comparisons were performed on a vertex-by-vertex general linear model including as independent variables EEG and covariate components, and were assessed non-parametrically at p<0.05 corrected for multiple comparisons (with FSL Threshold Free cluster Correction). Shown in figure 1A,B (and online supplementary etable 2), a significant negative relationship between the alpha component and the degree of atrophy in the left dorsal and ventral thalamus was observed (ie, the higher the acute alpha power and the lower its variance, the less the atrophy over time), as well as a significant positive relationship between the delta variance and extensive areas of atrophy along the rostrocaudal axis of the left thalamus, bilateral putamen and small regions of the right thalamus (ie, the higher the variance in the acute delta frequencies, the greater the atrophy). Shown in online supplementary efigure 1A, B and online supplementary etable 2, significant thalamic atrophy occurred over 6 months postinjury, with the dorsal aspects of the left thalamus correlating specifically with GOS-E6m, consistent with previous work.2
Supplemental material
Supplemental material
(A) Regions in which the degree of atrophy is significantly (negatively) related to the alpha power electroencephalography (EEG) component. (B) Regions in which the degree of atrophy is significantly (positively) related to the delta power variance components. (C) Graphical causal model: significant paths, with associated parameter estimate value, for the graphical causal model (see online supplementary efigure 2 for model specification). Bold arrows indicate paths with positive parameter estimate value, while dashed arrows indicate paths with negative parameter estimate value. α pow, alpha power component; δ avg, delta power average component; δ var, delta power variance component; A → C, acute to chronic change; COVAR comp, covariate components; exp vars, experimental variables component; frnt-par, frontoparietal component; GOS-E6m, Glasgow Outcome Scale—Extended at 6-month follow-up; sed, sedation component; tmp-occ, temporo-occipital component.
Supplemental material
Finally, EEG, MRI and covariate components were entered into a graphical causal model5 attempting to capture, jointly, the structure between these variables and their relationship to 6-month outcome (see online supplementary efigures 2, 3). Prior to this analysis, the shape change value for the hundreds of vertices in the thalamic meshes was averaged over anatomically defined thalamic regions and then submitted to a PCA, implemented identically to the two previous ones, returning two components: regions connecting to frontoparietal cortices and regions connecting to temporo-occipital cortices. The causal model was significant (χ2(10)=18.53, p=0.046; see figure 1C). Consistent with the EEG analysis above, the alpha component positively affected GOS-E6m, while the delta variance component affected it negatively (parameter estimate (PE)=1.01, p=0.007; and PE=−0.81, p=0.01, respectively). Consistent with the MRI shape analysis above, the delta variance component positively affected thalamic atrophy within the subregions connected to the frontoparietal cortices (PE=0.5, p=0.007). The age/sex and experimental variables components modulated the thalamic atrophy in regions connecting to frontoparietal and temporo-occipital cortices (PE=0.79, p<0.001; PE=−0.82, p=0.003, respectively). Finally, a significant positive relationship between atrophy in the thalamic regions projecting to temporo-occipital areas and GOS-E6m (PE=0.73, p=0.012) was also observed (see online supplementary etable 3).
Supplemental material
In conclusion, our findings show—although in a relatively small sample—that spectra characteristics derived from conventional EEG recordings in the acute setting predict subsequent subcortical secondary damage,2 3 as well as 6-month functional outcome, suggesting that, to some extent, the amount of secondary damage expressed over the first 6 months postinjury might well be determined very early after the primary insult and might be detectable with conventional bedside electrophysiological techniques.
Supplemental material
Footnotes
CS and ESL contributed equally.
Contributors MMM, CS, ESL and PMV conceived the study. CS, ESL and BJB analysed the data. All authors discussed and interpreted the results. CS, ESL and MMM drafted the manuscript. All authors provided critical feedback and input to the manuscript.
Competing interests None declared.
Funding This work received support from the James S McDonnell Foundation, Tiny Blue Dot Foundation and the Brain Injury Research Center (BIRC) at UCLA.
Patient consent Not required.
Ethics approval The protocol was approved by the University of California at Los Angeles Institutional Review Board.
Provenance and peer review Not commissioned; externally peer reviewed.