Article Text

Abstract
Background In patients with a C9orf72 repeat expansion (C9+), a neuroimaging phenotype with widespread structural cerebral changes has been found. We aimed to investigate the specificity of this neuroimaging phenotype in patients with amyotrophic lateral sclerosis (ALS).
Methods 156 C9− and 14 C9+ patients with ALS underwent high-resolution T1-weighted MRI; a subset (n=126) underwent diffusion-weighted imaging. Cortical thickness, subcortical volumes and white matter integrity were compared between C9+ and C9− patients. Using elastic net logistic regression, a model defining the neuroimaging phenotype of C9+ was determined and applied to C9− patients with ALS.
Results C9+ patients showed cortical thinning outside the precentral gyrus, extending to the bilateral pars opercularis, fusiform, lingual, isthmus-cingulate and superior parietal cortex, and smaller volumes of the right hippocampus and bilateral thalamus, and reduced white matter integrity of the inferior and superior longitudinal fasciculus compared with C9− patients (p<0.05). Among 128 C9− patients, we detected a subgroup of 27 (21%) with a neuroimaging phenotype congruent to C9+ patients, while 101 (79%) C9− patients showed cortical thinning restricted to the primary motor cortex. C9− patients with a ‘C9+’ neuroimaging phenotype had lower performance on the frontal assessment battery, compared with other C9− patients with ALS (p=0.004).
Conclusions This study shows that widespread structural brain involvement is not limited to C9+ patients, but also presents in a subgroup of C9− patients with ALS and relates to cognitive deficits. Our neuroimaging findings reveal an intermediate phenotype that may provide insight into the complex relationship between genetic factors and clinical characteristics.
This is an Open Access article distributed in accordance with the Creative Commons Attribution Non Commercial (CC BY-NC 4.0) license, which permits others to distribute, remix, adapt, build upon this work non-commercially, and license their derivative works on different terms, provided the original work is properly cited and the use is non-commercial. See: http://creativecommons.org/licenses/by-nc/4.0/
Statistics from Altmetric.com
Introduction
Of the genes which have been associated with amyotrophic lateral sclerosis (ALS), a repeat expansion in the C9orf72 gene is most commonly observed, contributing to 20–40% of the familial ALS cases and 5–10% of the patients with sporadic ALS in the Netherlands.1 Previous research has demonstrated that patients with ALS with the C9orf72 repeat expansion (C9+) show more cognitive and behavioural impairment compared with patients with ALS without the repeat expansion (C9−).2
MRI research has indicated that neurodegeneration in ALS is not restricted to the motor network; areas not directly involved in motor function also seem to be affected,3 including frontotemporal areas4–6 and subcortical structures.7 ,8 More widespread involvement has been demonstrated in C9+ patients with ALS compared with C9− patients with ALS,9 but whether this neuroimaging phenotype is specific for C9+ patients has not been investigated.
Considering the clinical heterogeneity of ALS, defining the patterns of neurodegeneration associated with C9− and C9+ ALS might shed light on the relation between structural brain involvement and clinical phenotypes, and might provide insight into the neurobiology of disease. Neuroimaging possibly reveals anatomical substrates of neuropsychological deficits as well as characteristic patterns of cerebral involvement in C9+ patients with ALS. It might contribute to our understanding about whether ALS is one disease or a collection of subtypes or a disease spectrum,10 and might be useful for stratifying patients in future therapeutic trials.
In this study, we investigated the neuroimaging phenotype of C9+ patients with ALS using structural and diffusion-weighted MRI, and investigated whether this neuroimaging phenotype is specific for C9+ ALS.
Methods
Participants
Patients were recruited from the outpatient clinic for motor neuron diseases at the University Medical Center Utrecht (UMC Utrecht). All patients were classified as having possible, probable or definite ALS according to the El Escorial Criteria. Clinical characteristics, including revised ALS Functional Rating Scale (ALSFRS-R), disease duration, age at onset, site of onset and handedness, were assessed. Fourteen C9+ and 156 C9− patients with ALS participated in this study. For comparison, 92 healthy controls were included as a reference group (see online supplementary table S1). Participants with a history of epilepsy, stroke or any overt structural brain abnormalities were excluded.
Supplemental material
Standard protocol approvals, registrations and patient consents
This study was approved by the Medical Ethical Committee of the UMC Utrecht and written informed consent was obtained from all participants.
Cognitive assessment
The Verbal Fluency Index (VFI)11 ,12 and Frontal Assessment Battery (FAB)13 were used to assess cognitive performance in patients with ALS. The VFI was calculated as previously described,11 with higher VFI scores indicating more severe cognitive impairment. The FAB is a short cognitive and behavioural testing battery to assess executive function, with lower scores reflecting more severe frontal lobe dysfunction.14
Detection of C9orf72 repeat expansion
Genomic DNA samples of patients with ALS were screened for the C9orf72 repeat expansion, using a repeat primed PCR as previously described.1 Patients with a repeat length of at least 30 repeats were classified as C9+ patients with ALS.
MRI acquisition
Images were acquired using a 3 Tesla Achieva Medical Scanner from Philips. A high-resolution T1-weighted image was made using the following parameters: three-dimensional fast field echo using parallel imaging; repetition time/echo time (TR/TE)=10/4.6 ms, flip angel 8°, slice orientation sagittal, 0.75×0.75×0.8 mm voxel size, field of view=160×240×240 mm and reconstruction matrix=200×320×320 covering the entire brain.
Diffusion-weighted imaging (DWI) was performed for reconstruction of major white matter tracts. Two sets of 30 weighted diffusion scans and 5 unweighted B0 scans were acquired with the following parameters: DWI using parallel imaging SENSE p-reduction 3; high angular gradient set of 30 different weighted directions, TR/TE=7035/68 ms, 2×2×2 mm voxel size, 75 slices, b=1000 s/mm2, second set with reversed k-space read-out to correct for susceptibility-induced distortions.
Image preprocessing
T1-weighted images were preprocessed using Freesurfer V.5.3 (http://surfer.nmr.mgh.harvard.edu/). The cerebral cortex was parcellated into 68 regions15 and segmented into 24 subcortical structures (deep grey matter, ventricles and cerebellum).16
DWI preprocessing included motion, eddy-current and susceptibility distortion corrections.17 ,18 Diffusion-weighted images were subsequently processed with the TRACULA tool (TRActs Constrained by UnderLying Anatomy) for automated reconstruction of major white matter tracts, using global probabilistic tractography.19 Default settings for TRACULA were used including affine registration of diffusion-weighted images to T1-weighted images and estimation of probability distributions of diffusion measures in every voxel using a ball-and-stick model with two compartments (to account for possible crossing and kissing fibres). In total, 7500 Markov chain Monte-Carlo samples were obtained to estimate posterior distributions of the white matter tracts. The final output included anisotropy and diffusivity-weighted metrics of white matter tracts, including fractional anisotropy (FA) and radial diffusivity (RD).
Statistical analysis
Differences in clinical, cognitive and demographic data between research groups were assessed by χ2 tests for categorical variables and linear models for continuous variables.
First, a region-wise analysis was performed analysing differences in cortical thickness per region. Second, a whole-brain vertex-wise comparison of cortical thickness was performed. Third, subcortical, cerebellar and ventricular volumes were measured with a region-wise analysis. FA and RD were compared between groups. Finally, we developed a model to capture the neuroimaging phenotype defining C9+ patients with ALS: the ‘C9+’ neuroimaging phenotype. On the basis of this model, patients with ALS were classified as having a ‘C9+’ neuroimaging phenotype or not.
Region-wise comparisons of C9+ and C9− patients with ALS were performed using linear modelling within the R software package for statistical computing V.3.1.0 (http://www.R-project.org). Age, gender and intracranial volume were used as covariates for all analyses, except for the analysis of white matter integrity, which included age and gender as covariates. To correct for possible non-normality, permutation tests (10 000 random permutations) were performed for all analyses. All analyses were corrected for multiple testing using false discovery rate (FDR). p Values <0.05, after correction for multiple testing, were considered to reflect statistically significant results. Original p values that reached statistical significance are reported.
In addition to the region-wise comparison of cortical thickness, a whole-brain vertex-wise comparison was performed using a linear model in Freesurfer. A cluster-wise correction was applied, using a Monte-Carlo simulation (10 000 iterations) with cluster threshold p<0.05. For comparison, the aforementioned analyses were repeated, comparing both C9+ and C9− patients with ALS to healthy controls (see online supplementary material).
To describe the pattern of brain involvement in C9+ ALS, we developed a model of structural imaging measures that distinguishes C9+ from C9− patients with ALS. To eliminate possible effects of age and gender on the classification as C9+ or C9−, we first fitted a linear model on all 92 brain regions of healthy participants (68 cortical regions and 24 subcortical regions) with age and gender as covariates. Subsequently, this model was used in a group of 170 patients with ALS (14 C9+ and 156 C9+ patients) to determine their dispersion (ie, residuals) from healthy controls per region. To find the variables defining the ‘C9+’ neuroimaging phenotype, elastic net (EN) logistic regression was performed. EN logistic regression is a form of penalised regression that provides simultaneous variable selection and shrinkage of the coefficients, thereby preventing overfitting (see online supplementary information 1 for information on EN logistic regression).20 This analysis was performed in 14 C9+ patients with ALS and 28 C9− patients with ALS, who were age and gender matched to the 14 C9+ patients with ALS, selected out of the group of 156 C9− patients with ALS. To assess whether this model captures the characteristics of C9+ patients with ALS, classification accuracy of the model was determined in the data set with 14 C9− vs 28 C9+ patients with ALS. This was performed as a minimal assessment of the performance of the model. To investigate whether the ‘C9+’ neuroimaging phenotype was also present within the group of C9− patients with ALS, we subsequently applied the model to the remaining 128 C9− patients with ALS (who were not used to develop the model) to identify those with and without a ‘C9+’ neuroimaging phenotype. Model applications were performed by determining the linear predictor in the remaining 128 C9− patients with ALS, which was converted to a probability for belonging to the group with or without the ‘C9+’ imaging phenotype. The linear predictor was calculated by multiplication of the coefficients (as estimated using EN logistic regression during model development) with the values of the corresponding brain regions in the 128 C9− patients with ALS who were not used for model development (without adjustment or refitting of the model). Finally, we determined whether any clinical variables were related to the ‘C9+’ neuroimaging phenotype. For completeness, we repeated the analysis with additional inclusion of Diffusion tensor imaging (DTI) data (together with T1 data) in the subgroup of patients with both DTI and T1 data (n=11). Results of this analysis should be interpreted with caution because of the smaller sample size while increasing the possible candidate predictors (ie, the FA and RD of the different tracts) which might cause instability of the model.
Results
Clinical characteristics
Characteristics of the study participants are shown in table 1. C9+ patients with ALS were younger than C9− patients with ALS (p=0.049) and demonstrated a higher VFI than C9− patients with ALS (p=0.003; table 1). Frequency of bulbar onset of symptoms did not differ significantly between C9+ and C9− (p=0.53) and rate of decline was similar (p=0.72).
Clinical and demographic characteristics of research groups
Cortical thickness: region-wise analysis
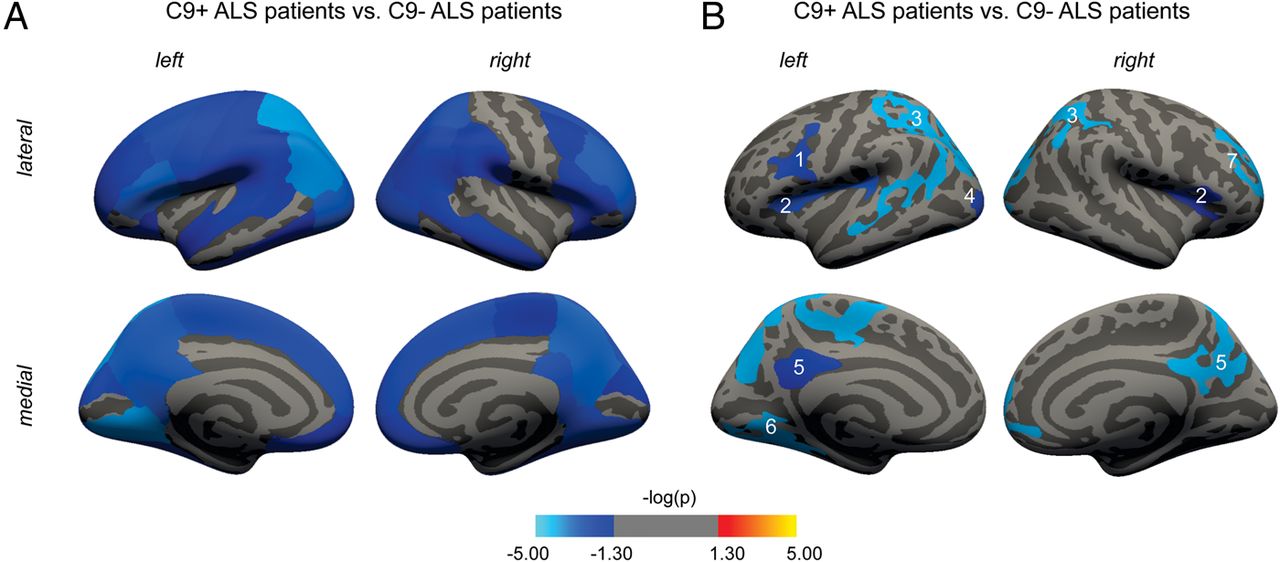
C9+ patients with ALS demonstrated more widespread cortical thinning compared with C9− patients with ALS, including cortical thinning in the bilateral superior parietal cortex (left: p=4.91×10⁻⁶; right: p=0.0006), cuneus (left: p=0.001; right: p=0.028), superior frontal cortex (left: p=0.0009; right: p=0.001) and lingual cortex (left: p=3.59×10⁻⁶; right: p=0.0006; figure 1A and see online supplementary table S2).

Region-wise and vertex-wise comparison of cortical thickness in C9− and C9+ patients with ALS. (A) Region-wise comparison of C9− and C9+ patients with ALS, showing widespread involvement of the cortex in C9+ patients with ALS. Blue-coloured areas show significant cortical thinning in C9+ patients with ALS compared with C9− patients with ALS (p<0.05, FDR-corrected). (B) Vertex-wise comparison between C9− and C9+ patients with ALS. Coloured clusters were significantly thinner in C9+ patients with ALS compared with C9− patients with ALS (cluster-wise corrected using a Monte-Carlo simulation with 10 000 iterations). 1=pars opercularis; 2=insula; 3=superior parietal (in the left hemisphere extending to the temporal lobe); 4=lateral occipital; 5=isthmus cingulate; 6=fusiform; 7=rostral middle frontal. ALS-FTD, amyotrophic lateral sclerosis with comorbid frontotemporal dementia; C9+, C9orf72 repeat expansion present; C9−, C9orf72 repeat expansion absent.
Compared with healthy controls, C9+ and C9− patients with ALS demonstrated different patterns of cerebral involvement as shown in online supplementary figure S1A and 1B. While C9− patients with ALS demonstrated cortical thinning restricted to the bilateral precentral gyrus (left: p=5.6×10⁻⁷; right: p=4.51×10⁻⁶), bilateral caudal middle frontal gyrus (left: p=0.005; right: p=0.004), right superior frontal (p=0.002) and right medial orbitofrontal gyrus (p=0.002), C9+ patients with ALS demonstrated cortical thinning in multiple brain regions including the bilateral pars opercularis (left: p=6.08×10⁻⁷; right: p=0.0002), inferior parietal cortex (left: p=7.88×10⁻⁶; right: p=0.002) and precuneus (left: p=1.99×10⁻⁵; right: p=2.37×10⁻⁵; see online supplementary table S2). Similar outcomes were found with additional correction for bulbar onset.
Cortical thickness: whole-brain vertex-wise comparison
Vertex-wise comparison of C9+ and C9− patients with ALS showed significant cortical thinning in 10 clusters located in seven different areas (figure 1B). Bilateral cortical thinning was found in the superior parietal cortex (left: p=0.0001; right: p=0.0001), insula (left: p=0.0024; right: p=0.0366) and the isthmus of the cingulate cortex (left: p=0.032; right: p=0.0001). Moreover, clusters were found in the left lateral occipital cortex (p=0.0055), left pars opercularis (p=0.0076), left fusiform gyrus (p=0.0001) and right rostral middle frontal cortex (p=0.0001).
Subcortical and ventricular volumes, cerebellum
Involvement of the basal ganglia was observed in C9+ patients with ALS, showing significantly smaller volumes of the bilateral thalamus (left: p=0.001; right: p=0.0002), caudate nucleus (left: p=0.007; right: p=0.004), putamen (left: p=0.007; right: p=0.004), nucleus accumbens (left: p=0.010; right: p=0.001) and right hippocampus (p=0.008) compared with C9− patients with ALS (see online supplementary figure S2 and table S3). Moreover, the third (p=0.017) and fourth ventricles (p=0.003) were larger in C9+ patients with ALS as compared with C9− patients with ALS. Involvement of the cerebellum was observed by smaller volumes of the bilateral cerebellar cortex in C9+ patients with ALS (left: p=0.001; right: p=0.001).
Comparison of C9+ and C9− patients with ALS with healthy controls is shown in online supplementary table S3.
White matter integrity
DWI was available for a subset of participants (115 C9− patients with ALS, 11 C9+ patients with ALS and 75 healthy controls). Comparison of C9+ and C9− patients with ALS demonstrated significant differences in the bilateral inferior longitudinal fasciculus and in parietal and temporal parts of the superior longitudinal fasciculus. In the inferior longitudinal fasciculus, C9+ patients with ALS demonstrated a higher RD (left: p=0.002; right: p=0.0005) and lower FA bilaterally (left: p=0.002; right: p=0.002; figure 2 and online supplementary table S4). C9+ patients with ALS showed higher RD of the right temporal part (p=0.006) and parietal part of the superior longitudinal fasciculus (p=0.003). C9+ patients with ALS showed a lower FA of the parietal part of the superior longitudinal fasciculus (p=0.003) compared with C9− patients with ALS.

Comparison of white matter integrity in C9− and C9+ patients with ALS. The ILF is bilaterally affected in C9+ patients with ALS, characterised by an increased RD and lower FA, compared with C9− patients with ALS. SLFP and SLFT showed increased RD of the SLFP and SLFT in the right hemisphere of C9+ patients. Dots are estimated marginal means (ie, means corrected for effects of age and gender) and whiskers represent 95% CIs. Comparisons between groups and corresponding p values are shown in online supplementary table S4. *p value <0.05 after FDR correction. ALS-FTD, amyotrophic lateral sclerosis with comorbid frontotemporal dementia; FA, fractional anisotropy; ILF, inferior longitudinal fasciculus; RD, radial diffusivity; SLFP, parietal parts of the superior longitudinal fasciculus; SLFT, temporal parts of the superior longitudinal fasciculus.
Model development and application of the ‘C9+’ neuroimaging phenotype
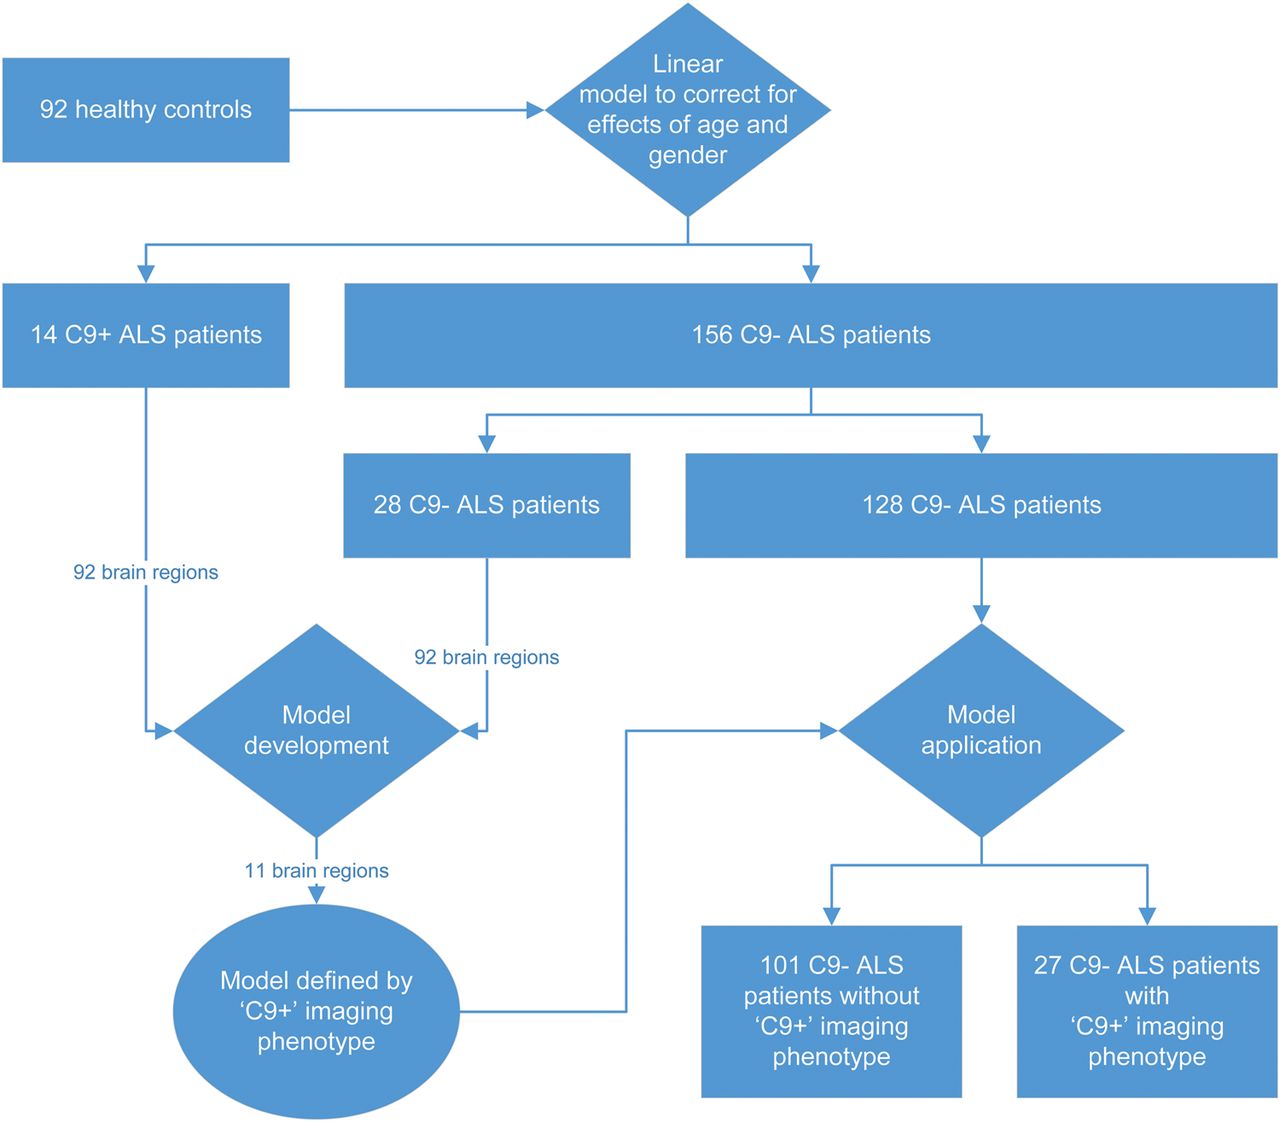
EN logistic regression was performed in a group of 42 C9+ and C9− patients with ALS (ratio 1:2, ALS C9+ n=14 vs ALS C9− n=28; see flow chart in figure 3). Eleven out of 92 structural variables defined the ‘C9+’ neuroimaging phenotype (left hemisphere: cortical thickness of the fusiform gyrus, lingual gyrus, pars opercularis, isthmus of the cingulate and volume of the thalamus; right hemisphere: isthmus of the cingulate, thalamus, hippocampus, amygdala and nucleus accumbens; fourth ventricle (regression coefficients are shown in online supplementary figure S3)). These 11 imaging variables enabled accurate classification of 40 out of 42 patients into C9+ or C9− (95.2%). Next, we applied this model to the group of 128 C9− patients with ALS (156 minus 28 C9− patients with ALS of the training set) to potentially identify those with a ‘C9+’ neuroimaging phenotype (see online supplementary figure S4). This resulted in the classification of a subgroup of C9− patients with ALS with a ‘C9+’ neuroimaging phenotype characterised by extensive structural brain involvement (n=27, 21%), while the other C9− patients with ALS (n=101, 79%) showed involvement restricted to the primary motor cortex on both sides (figure 4A). There was no difference between C9− patients with ALS and C9− patients with ALS with a ‘C9+’ neuroimaging phenotype regarding the 81 brain regions not included in the model (lowest p=0.304, FDR-corrected). Clinical characteristics of the groups are shown in figure 4B. C9− patients with ALS were younger than C9− patients with ALS with the ‘C9+’ neuroimaging phenotype (p=0.016); however, this difference in age could not be attributed to an implicit effect of age on the brain since classification was performed while effects of age and gender on the brain were eliminated. Regarding cognitive performance, C9− patients with ALS with a ‘C9+’ neuroimaging phenotype showed more executive dysfunction compared with C9− patients with ALS, as assessed by the FAB (p=0.004). There was no difference in survival between C9− patients with ALS and C9− patients with ALS with a ‘C9+’ neuroimaging phenotype (p=0.978). Repeating this analysis in the subgroup of patients with T1 and DTI data, we identified 24 C9− patients with a ‘C9+’ imaging phenotype out of 93 C9− patients (26%).

Flow chart of model development and application for classifying patients as C9+ or C9− based on neuroimaging phenotype. First, the model was developed in 14 C9+ patients with ALS and 28 age-matched and gender-matched C9− patients with ALS. A set of 11 imaging variables constituted the prediction model. Second, the model was applied to the remaining 128 C9− patients with ALS who were not used for model development. According to the model, 27 patients were classified with a ‘C9+’ neuroimaging phenotype and 101 patients with a C9− imaging phenotype. ACL, amyotrophic lateral sclerosis; C9+, C9orf72 repeat expansion present; C9−, C9orf72 repeat expansion absent.

Identification of patients with a C9orf72 neuroimaging phenotype in a group of C9− patients with ALS. (A) Elastic net logistic regression identified a characteristic pattern of brain involvement distinguishing C9+ from C9− patients with ALS based on 11 imaging variables, the ‘C9+’ neuroimaging phenotype. Patients with ALS were subsequently classified into patients with and without this characteristic neuroimaging phenotype, and cortical thickness was compared in a region-wise analysis with healthy controls (n=92). Blue-coloured areas show significant cortical thinning in patients with ALS compared with healthy controls (p<0.05, FDR-corrected). (B) Classification of a subgroup of 128 C9− patients with ALS (156 minus 28 C9− patients with ALS of the training set) revealed 27 C9− patients with ALS with a ‘C9+’ neuroimaging phenotype with widespread cortical involvement congruent to C9+ patients with ALS (n=14), whereas 101 C9− patients with ALS had a phenotype of cortical thinning restricted to the primary motor areas. Clinical characteristics are shown per study group. aFAB in a subset of patients (maximum score 18): C9+ ALS n=9, C9− ALS with ‘C9+’ neuroimaging phenotype n=18, C9− ALS without ‘C9+’ neuroimaging phenotype n=67. bVFI in a subset of patients: C9+ ALS n=8, C9− ALS with ‘C9+’ neuroimaging phenotype n=14, C9− ALS without ‘C9+’ neuroimaging phenotype n=64. cALS-FTD according to the Neary criteria. dp<0.01 (Mann-Whitney U). ALS-FRS R, ALS-Functional Rating Scale Revised; ALS-FTD, amyotrophic lateral sclerosis with comorbid frontal temporal dementia; FAB, Frontal Assessment Battery; NA, not available; VFI, Verbal Fluency Index.
Discussion
In this study, C9+ patients with ALS were found to have a neuroimaging phenotype with widespread cortical thinning, smaller volumes of deep grey matter structures and the cerebellar cortex, larger brain ventricles and involvement of frontal and temporal white matter tracts. We demonstrated that this neuroimaging phenotype is not limited to C9+ patients, but also present in a subgroup of C9− patients with ALS and relates to cognitive deficits. Apart from the C9orf72 repeat expansion, other genetic or environmental factors might cause shared disease mechanisms underlying this neuroimaging phenotype.
Our results indicate that a comparable neuroimaging phenotype can be detected both in C9+ and a subgroup of C9− patients with ALS that extends to regions outside the primary motor area, including the basal ganglia and cerebellum. The basal ganglia are involved in motor and non-motor pathways.21 Being part of frontal-subcortical circuits, involvement of these structures might contribute to the development of cognitive and behavioural changes in patients with ALS, as captured by a higher VFI of C9+ patients with ALS in this study. Decreased volume and changes in the shape of the thalamus in C9+ patients with ALS have been reported previously in imaging studies in ALS and frontotemporal dementia (FTD).7 ,8 ,22 Involvement of the cerebellum in C9+ patients with ALS has been demonstrated by histological studies of C9orf72 pathology.23–26
Besides extensive cortical and subcortical grey matter involvement, differences in white matter integrity between C9+ and C9− patients with ALS were also observed, including the inferior longitudinal fasciculus and superior longitudinal fasciculus. These white matter tracts constitute the connections between the frontal lobe and other lobes, and involvement of these tracts are potentially related to the higher incidence of cognitive and behavioural impairment in C9+ patients with ALS.27
By offering an intermediate phenotype, neuroimaging might provide the link between factors underlying the pathological mechanisms resulting in particular patterns of neurodegeneration and clinical phenotypes. Based on clinical and genetic research, cognitive and behavioural disturbances in ALS are now recognised as an important part of the ALS-FTD disease spectrum.28 The results of our study shed light on the complex relationship between genetics, cerebral changes and cognition by showing that the neuroimaging phenotype with widespread structural involvement found in C9+ patients with ALS may also be present in C9− patients with ALS. Involvement of regions outside the primary motor areas might relate to cognitive deficits found in patients with ALS. Cognitive assessment in this study was limited to the VFI in 60% and FAB in 66% of the patients with ALS. However, C9+ patients with ALS had a lower performance on the VFI, and C9− patients with ALS with a ‘C9+’ neuroimaging phenotype performed worse on the FAB. Since most of the patients were included and scanned before a Dutch version of the Edinburgh Cognitive and Behavioural ALS Screen (ECAS) had been validated,29 ECAS data were not available, leaving the precise clinical manifestation in terms of cognitive and behavioural deficits to be further explored. Cognitive and behavioural impairment might have compromised study participation in our study,30 thereby introducing a selection bias towards less severely affected C9+ and C9− patients with ALS. Selection bias might also explain a relatively longer survival in C9+ patients in this study compared with a previously published paper from our group involving a population-based cohort.1 More extensive cognitive and behavioural testing will further elucidate the profile of cognitive and behavioural deficits resulting from the pattern of cerebral involvement that is encountered in the ‘C9+’ neuroimaging phenotype.
Involvement of regions that in this study were found to differ between C9+ and C9− patients was, apart from the left isthmus, not reported in a previous study in asymptomatic carriers of a C9orf72 repeat expansion,31 suggesting that structural changes in most regions are specifically related to the symptomatic stage of disease. We showed that neuroimaging phenotypes of patients with known mutations might be used as prior information to discover subgroups of patients with sporadic ALS who could not be detected by comparisons of groups of patients with ALS with healthy participants (see online supplementary figure S1A). Furthermore, our study demonstrates that neuroimaging in ALS may offer a detailed intermediate phenotype, providing a link between genetics and clinical presentation and suggests that other currently unknown factors might result in shared disease mechanisms and clinical phenotypes. This approach might lead to increased power to discover new genetic or environmental factors involved in ALS.
References
Footnotes
H-JW and RW contributed equally.
Contributors H-JW, RW, MS, MPvdH, JHV and LHvdB contributed to the study concept and design. H-JW, RW, RS, EV and JH participated in data collection and processing. H-JW, RW, MS, RS, JHV, MPvdH and LHvdB contributed to the analysis and interpretation of data. H-JW, RW and MS wrote the manuscript. RS, JHV, MPvdH and LHvdB revised the manuscript for important intellectual content. LHvdB and MPvdH provided study supervision and obtained funding.
Funding This study was supported by the ALS Foundation Netherlands, the European Community's Health Seventh Framework Programme (grant agreement n° 259867), and The Netherlands Organization for Health Research and Development: SOPHIA project (funded through the EU Joint Programme—Neurodegenerative Disease Research, JPND).
Competing interests LHvdB reports grants from ALS Foundation Netherlands, grants from The Netherlands Organization for Health Research and Development (Vici scheme), grants from The European Community's Health Seventh Framework Programme (grant agreement n° 259867 (EuroMOTOR)), and grants from The Netherlands Organization for Health Research and Development: SOPHIA, funded through the EU Joint Programme—Neurodegenerative Disease Research, JPND, during the conduct of the study; personal fees from Biogen, personal fees from Cytokinetics, grants and personal fees from Baxalta outside the submitted work.
Patient consent Obtained.
Ethics approval Medical Ethical Committee of the University Medical Center Utrecht.
Provenance and peer review Not commissioned; externally peer reviewed.